KEYWORDS
Adverse drug event, clinical pharmacist intervention, intensive care unit, cost-benefit ratio, cost avoidance, cost saving
INTRODUCTION
As patients and medication are complex on the intensive care unit (ICU), the risk of prescribing errors and related adverse drug events (ADEs) is high.1-6 Kopp et al.5 found that the medication errors, leading to preventable ADEs at the ICU occurred mostly at the process of prescribing. ‘Lack of drug knowledge’ and ‘inadequate monitoring’ were the most common proximal causes of errors. ADEs are associated with extra treatment needs, extended hospital stay, morbidity and mortality and they induce extra healthcare costs.7,8 Estimations of the ADE cost price vary from €970, based on a German micro-costing study (extended hospital stay of 2.9 days)7 to €4395, based on an American study by Bates in 19979 (extended hospital stay of 4.6 days).
Over the last 30 years, clinical pharmacists have become part of the multidisciplinary team in the ICU, especially in North America.10,11 They provide a wide range of patient care services with the aim of maximising patient safety and optimising patient outcomes.12-14 Interventions performed by clinical pharmacists significantly reduce ADEs.15-17 Direct patient care by clinical pharmacists at the ICU is associated with shortened length of hospital stay, lower overall costs and may even contribute to reduced mortality.18-20 However, these findings are not generalisable as such, since these studies were performed in North America and their setting is different from the European setting. Whereas the American pharmacists have been intensively involved in critical care for many years,21 in Europe most hospital pharmacies do not have a clinical pharmacy service. As a result Europe has about 17 times less pharmacists, i.e. 1.1 hospital pharmacists/100 beds. In the Netherlands this number is even lower (0.75 hospital pharmacists/100 beds).22,23
Despite the fact that over the last decade the involvement of clinical pharmacists in Dutch ICUs is gradually increasing, information about the benefit of their clinical practice is still missing. One way to evaluate this benefit is by measuring the proportion of pharmacist interventions accepted by physicians during patient rounds. Several studies have measured the proportion of accepted pharmacist interventions on the ICU, as part of their study, with outcomes varying from 71-99%.16,17,24
In addition, costs in healthcare are increasing fast, so cost-benefit analyses are required to increase the likelihood that implementation of beneficial healthcare services, such as clinical pharmacy, will actually occur. Up to now, only a few European studies have calculated costs of interventions made by clinical pharmacists in the ICU.16,21,24 All studies were single centre and the economic outcomes differed greatly between these studies.
Therefore, a prospective quality improvement study was performed in two ICUs in the Netherlands with the primary aim to determine the proportion of pharmacist interventions accepted by physicians during ICU patient rounds. Secondary aims were to determine the clinical relevance of the accepted interventions, the proportion of prevented potential ADEs (pADEs) and the cost-benefit associated with the introduction of ICU pharmacists.
MATERIAL AND METHODS
Study design
An interventional, prospective quality improvement study in two different ICU settings was designed. Since the study was considered a quality improvement study, which did not affect patient integrity, Medical Ethics Committee approval was not needed according to Dutch clinical trial law.
Setting
The study was performed in the adult ICUs of the Haga Teaching Hospital (GTH) from July to December 2008 and the ICU of the Erasmus University Medical Centre (UH) from July to September 2011. These periods were several years apart in order to enable the same pharmacist to implement the same clinical pharmacy service in both settings, including an extensive training period in Erasmus MC (see description of the intervention).
The GTH consisted of a 12-bed ICU and the UH of a 36-bed ICU. The UH ICU was divided into two departments, both treating the same types of medical and surgical patients. Both ICUs were closed format and the medical staff consisted of a team of certified intensivists and residents. The UH ICU also trained ICU fellows. In both ICUs, the ICU staff worked according to national and local guidelines. Both ICUs worked with a Patient Data Management System (PDMS). The GTH ICU used Metavision (Itémedical BV, Tiel, the Netherlands) and the UH ICU used Care Suite 8.2 (PICIS Inc., Wakefield, Massachusetts, USA). Both PDMSs offered a continuous collection and display of vital patient data, such as laboratory values and data from medical devices. Both ICUs had a daily patient round. Before the study, pharmacists primarily fulfilled their role for the ICU from the central pharmacy with limited time spent on the ICU, i.e. pharmacists did not have any role in medication preparation, medication order review or medication reconciliation. Their role was limited to consultation on demand by the ICU doctor. Drug delivery and dispensing to the ICU was done by pharmacy technicians.
Study population
Patients were included when they were staying in the ICU during the patient round in which the pharmacist participated. No exclusion criteria were applied.
Description of the pharmacist intervention
Based on a clinical pharmacist model derived from an American clinical skills program, which was previously practised at an internal ward,25,26 we developed a proactive ICU pharmacist intervention method. This method consisted of collecting medication orders, patient information, followed by an assessment of appropriateness, indication, duration of therapy, drug dosage and frequency, adjustment to renal function, drug-drug interactions, contraindications, drug omissions and duplicate medication. Furthermore the clinical effects of the patient’s pharmacotherapy were analysed. A check on missing (prophylactic) medicines was also performed. During the patient round the collected interventions were discussed with the attending intensivists.
The leading pharmacist (NH) was extensively trained at the GTH ICU for 6 months. In the UH this pharmacist took a period of five months to become familiar with the local ICU guidelines and daily routines. Subsequently, she trained three pharmacists prior to the UH intervention period.
During the 6-month study period in the GTH and the 3-month study period in the UH, patient rounds were attended twice a week. Each included patient in the UH was reviewed once a week and in the GTH twice a week.
Primary outcome measure
The primary outcome measure was the proportion of pharmacist interventions that were accepted by doctors.
Secondary outcome measures
Secondary outcome measures were the clinical relevance and the prevented pADEs of the accepted interventions. The clinical relevance of the accepted interventions was assessed retrospectively in two ways: a clinical relevance score (Overhage method)27 and a pADE score (Nesbit method),28 both methods are explained in table 1. Two assessors – one intensivist (PM) and one hospital pharmacist (BB) with clinical ICU experience – performed both assessments independently. If the two assessors scored interventions differently, consensus was reached in a consensus meeting.
Overhage method: Severity of reasons for intervention and value of service
This validated method from previous research of pharmacists’ clinical activities26,27 classifies each intervention in two ways: A-E for the severity of the reason for intervention and 1-6 for the clinical relevance of the pharmacist’s intervention. Before scoring the interventions with this system, a number of adjustments were made in order to make the scoring method more specific for the ICU setting. Specific examples to assist in the proper classification were added. A summary of the instrument, including the specific ICU adjustments, is shown in table 1.
Nesbit method: Prevented pADEs
All accepted interventions were given a pADE probability score, according to Nesbit et al.28 (table 1). We assumed that none of the interventions would increase the likelihood of a pADE. 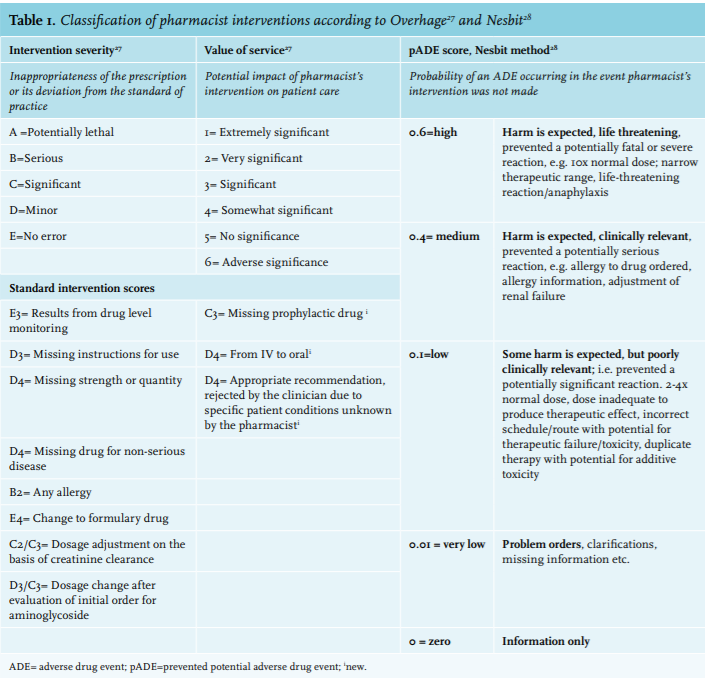
Preliminary cost benefit analysis
Cost savings and cost avoidance were estimated, summed and compared with cost of service, to calculate the net financial impact on the institution and the preliminary cost-benefit ratio. Where necessary, costs were adjusted to 2014 using the general price index of the Dutch Central Bureau of Statistics in 2014.29
Costs, cost avoidance and savings were expressed for the intervention period and subsequently extrapolated to one year (annual costs and savings), per accepted intervention and per monitored patient days.
Cost avoidance
Cost avoidance is achieved whenever an intervention, with the potential to prevent or detect an ADE, is accepted. It refers to an intervention that reduces or eliminates additional expenditure that otherwise may have occurred.15 We measured the cost avoidance by multiplying the Nesbit pADE scores with the costs of an ADE. The ADE cost was derived from a study by Rottenkolber,7 which utilised a micro-costing approach based on data from German hospitals18 and was adjusted to 2014.
Cost savings
Potential cost savings refer to reductions in current spending due to changes in the expenditure on patient treatment.28 We selected all accepted stop and dose reducing interventions and measured the daily drug costs involved, based on the Dutch medication price list.30 For non-listed drugs, the internal hospital cost price was used and 6% tax was added.31 Dosage reduction costs were calculated based on the difference in costs between the original and reduced dosage. The daily drug costs were multiplied by the number of days left on ICU.
Costs of service
The direct labour time spent on this intervention was calculated using the bottom up approach, based on the duration of the preparation and attendance of patient rounds and the time for entering intervention information in the database. The time investment related to training prior to the study period was not included in the cost analysis, as this is normally excluded in an economic evaluation.32 The direct labour time was multiplied by the unit costs of labour and a marginal mark-up percentage to account for indirect labour time (43%).31 The unit costs of labour were based on standardised costs per hour: €70.81 (GTH) and €70.27 (UH), which equalled the normative income.
Data collection
Patient characteristics
The following patient characteristics were collected from the electronic patient records: age, gender, length of stay on ICU, type of ICU admission (acute or surgical), APACHE IV score (Acute Physiology and Chronic Health evaluation), SAPS II score (Simplified Acute Physiology Score) and finally whether the patient died in ICU.33
Intervention characteristics
The following intervention characteristics were collected: drug involved, patient involved, date, intervention description, response prescriber, intervention accepted and three intervention categories:
(1) Reason for intervention
The reasons for interventions were classified as: drug-drug interaction, inappropriate route of administration, wrong drug choice, no indication, omission of therapy, wrong dosage, duplicate medication, contraindication, administrative error and no error/clarification required.
(2) Type of intervention
The interventions were classified as: addition of a drug (start), stopping a drug, dosage increase, dosage reduction, instructions for use, switch of a drug, switch route of administration, correction of an administrative error (i.e. double administration of prescription in PDMS), information only and finally therapeutic drug monitoring and toxicology screening (monitoring). All of these types together, with the exception of ‘information only’, are defined as recommendation interventions.
(3) Drug involved
The drugs involved were grouped into the following categories: gastrointestinal medication, antimicrobials, sedatives & pain medication, antithrombotics, medication involving the central nervous system (CNS), cardiac medication (including antihypertensives), and a rest group consisting of other drugs.
Furthermore we counted the number of patients per patient round, the number of patient rounds, the number of monitored patient days (MPD), the number of reviews per patient and finally the number of hours the pharmacists spent on the intervention. An MPD was defined as each patient day in the ICU during which the pharmacist reviewed the patient’s medication.16
Data analysis
Patient data and clinical pharmacist intervention data were entered into SPSS (IBM SPSS Statistics version 21, IBM Corp. New York) for descriptive data analysis.
For the cost-benefit analysis, a one-way sensitivity analysis was performed for known variables in order to determine the effect of varying these estimates on the preliminary cost-benefit analysis:
For varying the labour costs we used the data of a previous study.32 For varying the salary costs we used the highest senior hospital pharmacist scale and the lowest point on a basic pharmacist scale. For ADE costs we used previously published costs of an ADE9 and the Dutch costs for 2.9 extra days on the ICU.7,34 The ADE probability was varied by ± 50%.9,15 For the cost savings we reduced the maximum effect of a cost saving intervention to 2 days. Finally we measured what the cost-benefit ratio would be in case of poor acceptance, i.e. acceptance of half of the interventions made by the pharmacist (acceptance = 50%) and in case of high acceptance, meaning 100% of the interventions made by the pharmacist were accepted.
RESULTS
Patient, clinical pharmacist service and intervention characteristics
In the GTH, 160 patients were included and in the UH 174. Patient and intervention characteristics are shown in table 2.
During the study period 50 patient rounds were attended in the GTH and 33 in the UH, resulting in 367 and 274 MPD respectively. The number of patients reviewed per patient round was almost twice as high in the UH compared with the GTH. Since the GTH had 1 ICU ward, which was visited twice a week, whereas the UH had 2 ICU wards, which were each visited once a week, the number of reviews per patient in the GTH was higher.
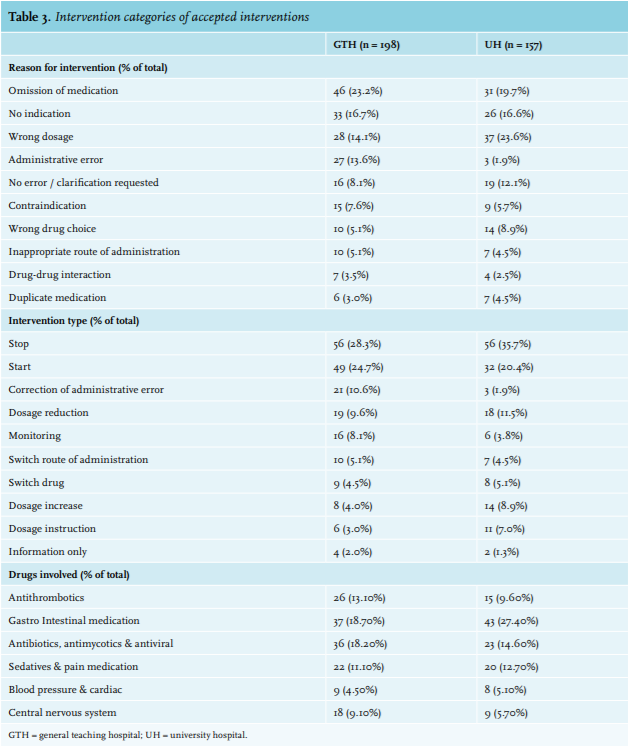
Table 3 shows the intervention categories. Omission of a drug was the most frequently occurring reason for intervention (GTH = 20.8% and UH = 23.6%). ‘Stop’ and ‘Start’ interventions were scored most.
Twenty-four (18.0%) different drugs were involved in half of the accepted interventions. Most interventions involved prophylactic drugs, such as low-molecular-weight heparin (LMWH) for thrombosis or proton pump inhibitors (PPIs) for stress ulcers, antimicrobials, sedatives and corticosteroids.
In both hospitals, the medication class most often leading to a pharmacist intervention was gastrointestinal (37 interventions [18.7%] in the GTH and 43 [27.4%] in the UH). For example, the pharmacist frequently advised to stop erythromycin (used as a prokinetic medicine, 16 interventions) and PPIs (6 interventions), with the absence of an indication as underlying reason. Additionally, the pharmacist frequently advised to add PPIs (5 interventions) and laxatives (23 interventions) as prophylactic medication. The second medication group most frequently intervened on were antimicrobials (36 interventions [18.1%] in the GTH and 23 [14.6%] in the UH). This group involved 22 different drugs. Pharmacists frequently enquired if there was still an indication for prescribing the antibiotic (9 interventions). They also frequently recommended to reduce the dose of antimicrobial drugs in patients with impaired kidney function (13 interventions). 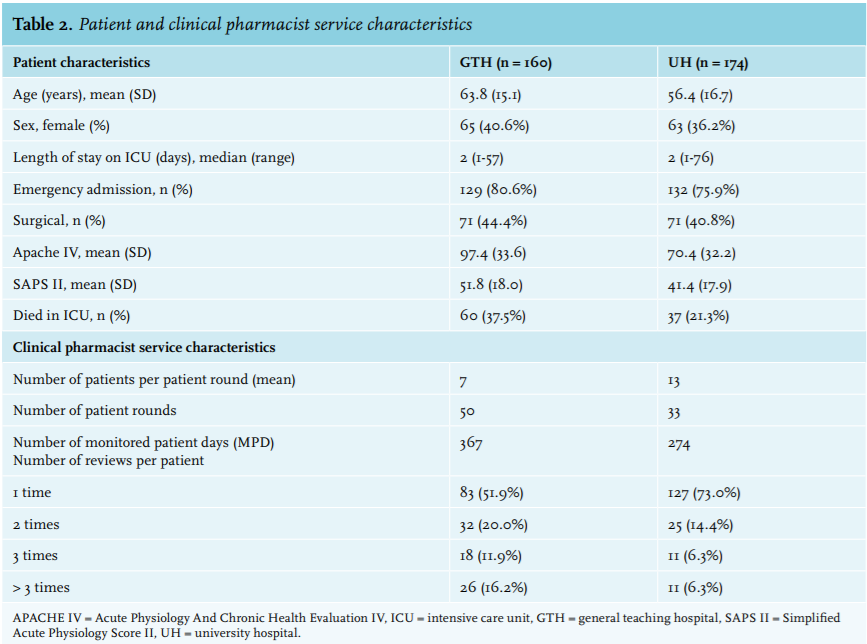
Primary outcome: Acceptance of the interventions
We observed 198 pharmacist interventions accepted in the GTH and 157 in the UH . Acceptance of the recommended interventions was 67.3% in the GTH and 61.8% in the UH (table 4).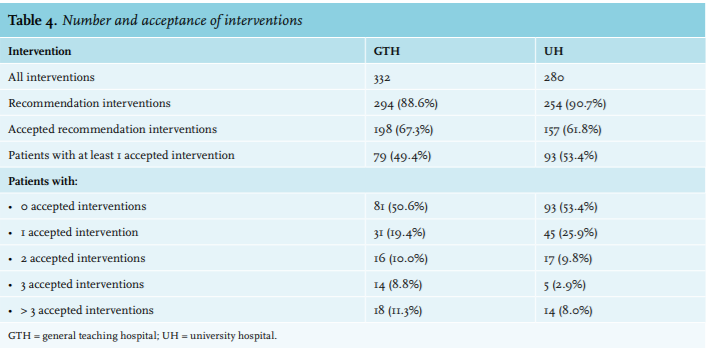
Clinical relevance and prevented potential ADE scores
The results of the secondary clinical outcomes are shown in figure 1 and are explained below.
Clinical relevance of the accepted interventions
The majority of issues, leading to accepted interventions (249 interventions), were given a ‘significant’ score (GTH: 63.6% and UH: 78.3%) (figure 1). Examples of ‘significant’ issues were ‘omission of drug’ or ‘no indication’. One drug-drug interaction in the GTH that led to an intervention was scored as potentially lethal. This interaction involved four medicines, known for their potential to prolong the QT interval (3dd 500 mg erythromycin, 3dd 1 mg haloperidol, 1200 mg continuous amiodarone, and 3dd 20 mg metoclopramide). These medicines were used simultaneously in an 82-year-old male patient with atrium fibrillation and a heart rate varying from 83-129 bpm. The QTc value, after starting erythromycin, was found to be > 500 msec. After the pharmacist’s intervention, erythromycin was immediately switched, the metoclopramide stopped and after a few days the amiodarone was stopped. Twenty-one detected issues leading to accepted interventions were given a ‘serious’ score (7.1% [GTH] and 4.5%[UH]).
The potential impact of the majority of the accepted interventions (268 interventions) was scored as ‘significant’ (GTH: 77.3% and UH: 73.2%). For 39 accepted interventions (GTH: 11.1% and UH: 10.8%), the potential impact was ‘very significant’.
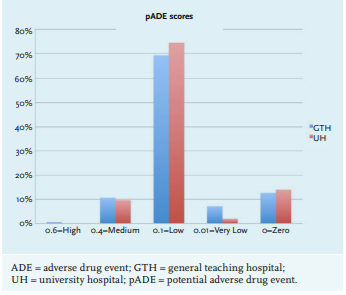
Prevented potential adverse drug events
In the GTH 22.84 pADEs were calculated and this was 17.73 pADE in the UH, leading to a pADE proportion of 0.16 (GTH) and 0.11 (UH) per patient or 0.52 and 0.57 pADEs per patient round. 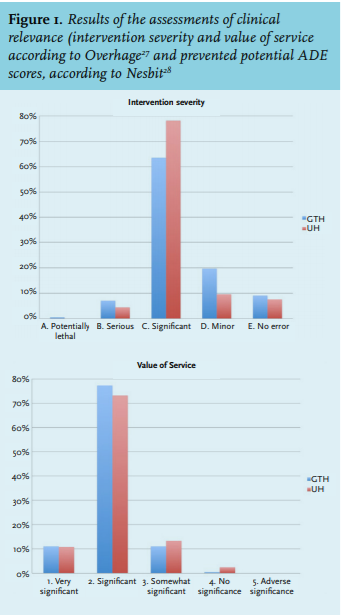
Preliminary cost benefit analysis and sensitivity analysis
Table 5 shows a positive preliminary cost-benefit ratio of 3.34 (GTH) and 3.23 (UH).
The cost of service was based on 100 (GTH) and 95.1 (UH) direct labour hours spent on the service.
The potential cost savings for medication were based on 77 accepted interventions regarding stopping and dosage reduction in the GTH ICU and 74 in the UH ICU. The multiplied prevented pADE scores, according to Nesbit, were 22.72 (GTH) and 17.64 (UH) respectively and were multiplied by the ADE cost found in literature,7 which was adjusted to 2014 cost (€1079). This lead to a net cost benefit of €119 (GTH) and €136 (UH) per accepted intervention.
In the sensitivity analysis the cost-benefit remained positive in all measured scenarios. The largest variance was found in cost assigned to an ADE.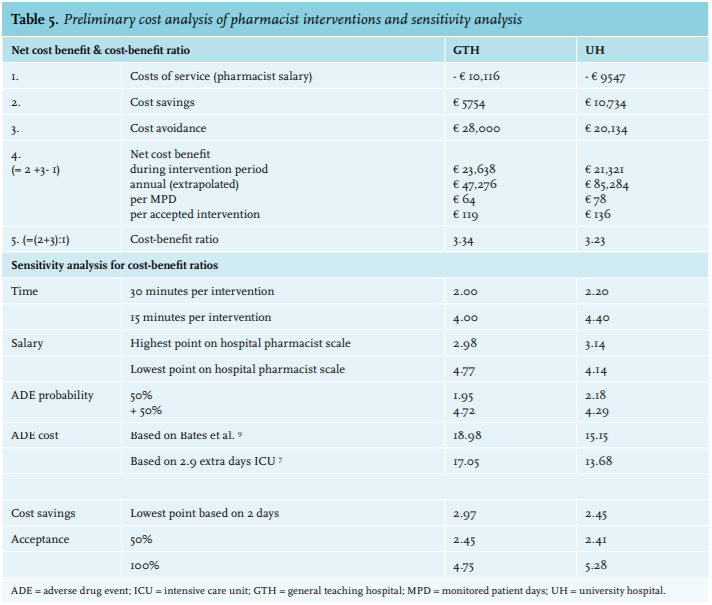
DISCUSSION
To our knowledge, this is the first study looking into the clinical and financial impact of pharmacist interventions in two different ICU settings.
The proportion of accepted interventions in our study was 67.3% in the GTH and 61.8% in the UH. This acceptance was comparable with Klopotowska’s study (71%), but lower when compared with American and Belgian research.15-17,24 Our lower outcome can be caused by the fact that our clinical pharmacy service was relatively new on both ICUs at the time of study. The acceptance rate will probably increase over time when the ICU team and the pharmacists become more adapted to each other. Such a learning curve was found by Klopotowska et al.16 On the other hand, our clinical model relied on a proactive attitude of the pharmacist during the patient rounds which, as a consequence, led to more ‘interfering’ interventions the medical staff were unfamiliar with and not always willing to accept. For example, more than half of our interventions were to stop and start interventions. Compared with the literature, these percentages were high.14,16,17 In contrast, 70% of the interventions made by Leape et al.17 were more conventional interventions such as ‘correction of an order’ or ‘provision of drug information’. These types of interventions are easily accepted, increasing the overall proportion of accepted interventions.
Our clinical pharmacy model led to a high number of interventions in both hospitals. Compared with Klopotowska’s study we found 8 (GTH) to 9 (UH) times more interventions per MPD.16 In addition, the clinical relevance of the accepted interventions was found to be significant or highly significant in about 85% of the cases. Unfortunately, a direct comparison of the relevance of the interventions between studies was not possible, since rating the clinical relevance of the interventions was not previously done in ICU studies. Nonetheless, compared with a previous study in an internal medicine ward in the Netherlands, the relevance of interventions made in our ICU settings was higher,26 which can be explained by the critical illness of our patients and their complex poly-pharmacy.
In our study we found a net cost benefit of €119 (GTH) and €136 (UH) per accepted intervention. The cost-benefit ratio remained positive under all conditions examined in the one-way sensitivity analysis. In comparison, Kopp et al.13 found that the addition of a critical care pharmacist to an ICU generated a cost avoidance of €1497 to €1516 per intervention. This large difference can be explained by the higher cost price used for an ADE (€975 vs. €5999) and the fact that they omitted pharmacist salary expenditures in their study.
Our study had several strengths. It is the first study in ICU patients measuring the acceptance of interventions of a clinical pharmacist service in two different settings. It was a real life, quality improvement study with a considerable number of patients and interventions included, leading to robust results. Finally, clinical relevance and prevented ADEs were determined using a panel consisting of multidisciplinary expertise.
Several limitations need to be addressed as well. First, since we did not have a control group in this study, conclusions about the clinical relevance of our model could only be made with caution. But as the main outcome measure was the proportion of accepted recommendations, a control group was not feasible. Second, one could argue that the study was performed several years ago. To date, we are still working in both ICUs in the same manner as was studied, confirming that our study results are still valid. Third, although this study was not a single centre study, conclusions would have been stronger had this study been performed in more than two hospitals over a longer period of time. Finally, the cost-benefit ratio was preliminary and based on a model that estimated cost avoidance of ADEs and estimated prevented costs. For this reason we used the most conservative ADE price.
In conclusion, quality improvement by implementation of a clinical pharmacy service in two different ICU settings resulted in high numbers of accepted and clinically relevant interventions. The service appeared to be cost effective in both ICU settings. This study indicates that this clinical pharmacy service is an effective method for improving patient safety and can be implemented in different ICU settings.
ACKNOWLEDGEMENTS
We thank Matthijs Becker and Anna de Goede for their participation in the patient rounds in the UH ICU.
DISCLOSURES
The authors declare that they have no competing interests. None of them have received honoraria, reimbursement or fees from any pharmaceutical companies in relation to the subject of the study.
REFERENCES