KEYWORDS
Cost of illness, diabetes mellitus, economic burden, the Netherlands
INTRODUCTION
Diabetes mellitus (DM) is one of the most common chronic diseases in the Netherlands.1 It has two primary forms, type 1 and type 2. Type 1 DM (T1DM) is an autoimmune disorder, affecting approximately 10% of those with DM, in which the body’s ability to produce insulin is severely disturbed. It is usually diagnosed in children or young adults, but it can become manifest at any age, with the exact cause of the disease still unknown.2,3 Type 2 DM (T2DM) is the most common form of DM, affecting approximately 90% of those with DM. The causes of T2DM are multifactorial and include both impaired insulin secretion, and a resistance of the body to the effect of insulin, resulting in hyperglycaemia.2-4 It usually occurs in adults over 40, but is increasingly seen at younger ages. Risk factors for T2DM include obesity, physical inactivity, poor nutrition, genetic predisposition, and a family history of DM.1,2 DM is associated with a number of disabling long-term complications due to consistently elevated blood glucose levels, such as cardiovascular disease, retinopathy, neuropathy, kidney failure and lower-limb amputation. These complications have a significant impact on patients’ quality of life.2,5,6 Furthermore, anti-hyperglycaemic agents, particularly insulin, can additionally lead to minor or major hypoglycaemia.7 Treatment of T2DM in particular is challenging, as it is multidimensional, often involves multiple caregivers and includes immediate lifestyle changes and treatment in order to prevent or delay the occurrence of complications many years later.8 Optimal self-management and adherence to DM medication remains an ongoing issue.9
DM is a growing problem for society. In 2014 there were an estimated 1,078,400 diagnosed DM patients in the Netherlands.1 From 2000 to 2007, the DM prevalence rose by 55%, from 480,000 patients in 2000 to 740,000 in 2007, due to a combination of demographics, lifestyle factors and enhanced detection methods. A projection published in 2009 estimated that the DM prevalence would increase to 1,320,000 patients in 2025.10
DM is associated with a substantial economic burden.2,11,12 The total economic burden of DM includes the direct costs of treating the illness, but it also includes the costs of treating DM complications, the costs of productivity losses due to DM and its complications, and the costs of welfare payments due to DM-related disability.
Insight into the current total economic burden of DM and its complications is essential for decision makers and payers, especially in this era of rising health expenditures, pressure on payers and initiatives for cost reduction. Understanding the total economic burden of a disease and the cost components that make up this burden is crucial in order to make informed policy decisions. Furthermore, a complete overview of the economic burden of DM may help physicians making informed decisions regarding disease-specific care.13
Unfortunately, the currently available estimates of the total economic burden of DM and its complications in the Netherlands only include parts of the total burden or are no longer up-to-date.1,14-19 For instance, an estimate of the healthcare costs due to DM was published by the Dutch National Institute of Public Health and the Environment (RIVM) in 2011 and did not include the cost of complications, productivity loss costs or welfare payment costs.1 A study by Booz & Company did include all cost components making up the total economic burden of DM, but was published in 2010.16 Other cost estimates are more recent, but only focus on the costs of DM medication and/ or monitoring.15,18,19
Therefore, the aim of this study was to determine the current total economic burden of diabetes mellitus and its complications in the Netherlands, by including all relevant cost components, such as healthcare costs, costs of complications and indirect costs.
MATERIALS AND METHODS
Systematic literature review and targeted review
This study combined a systematic literature review (SLR) and a targeted review to maximise the likelihood that all available evidence relating to the current total economic burden of DM and its complications in the Netherlands was identified.
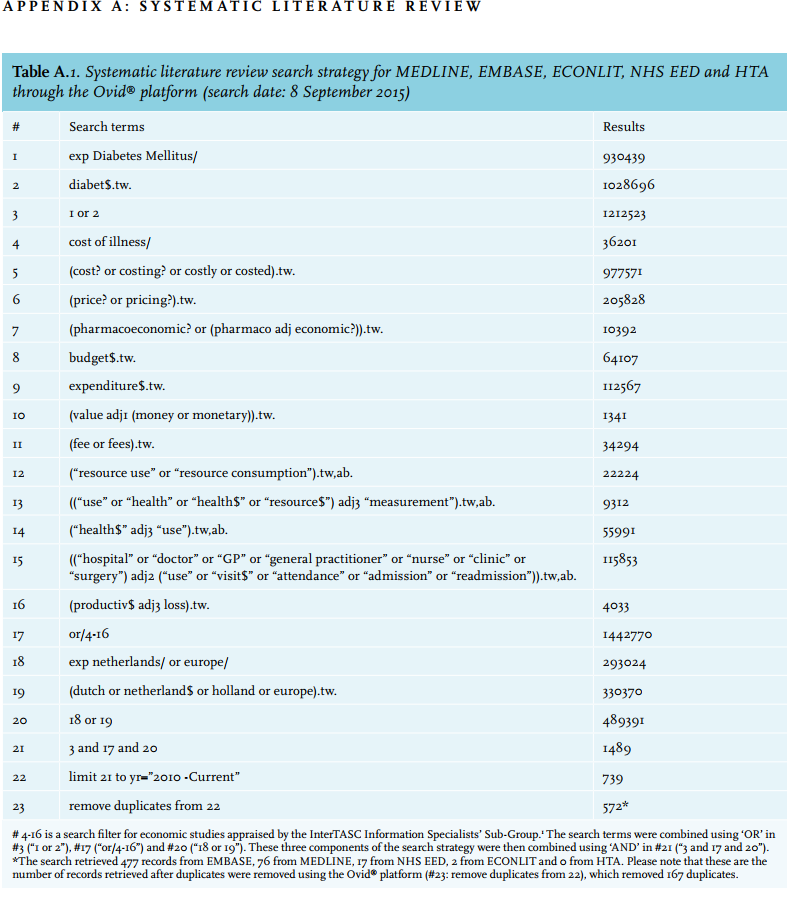
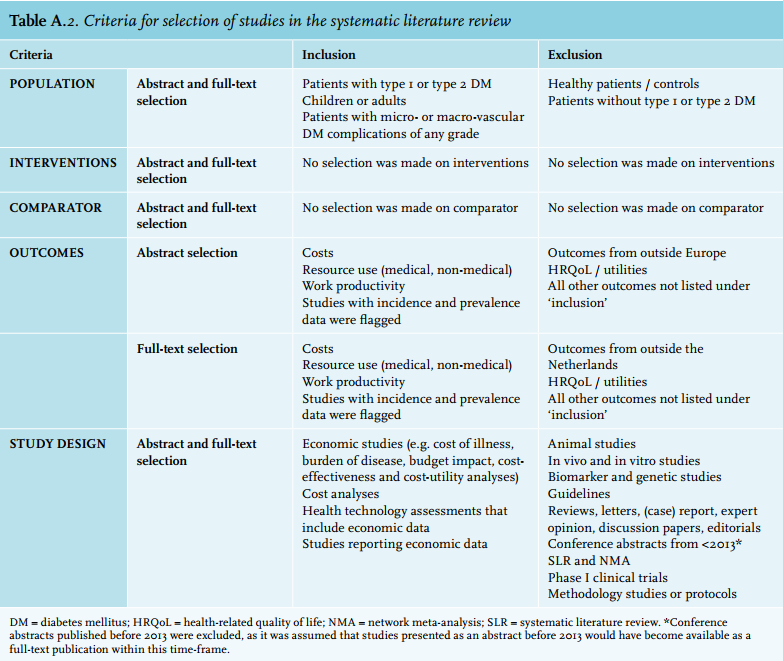
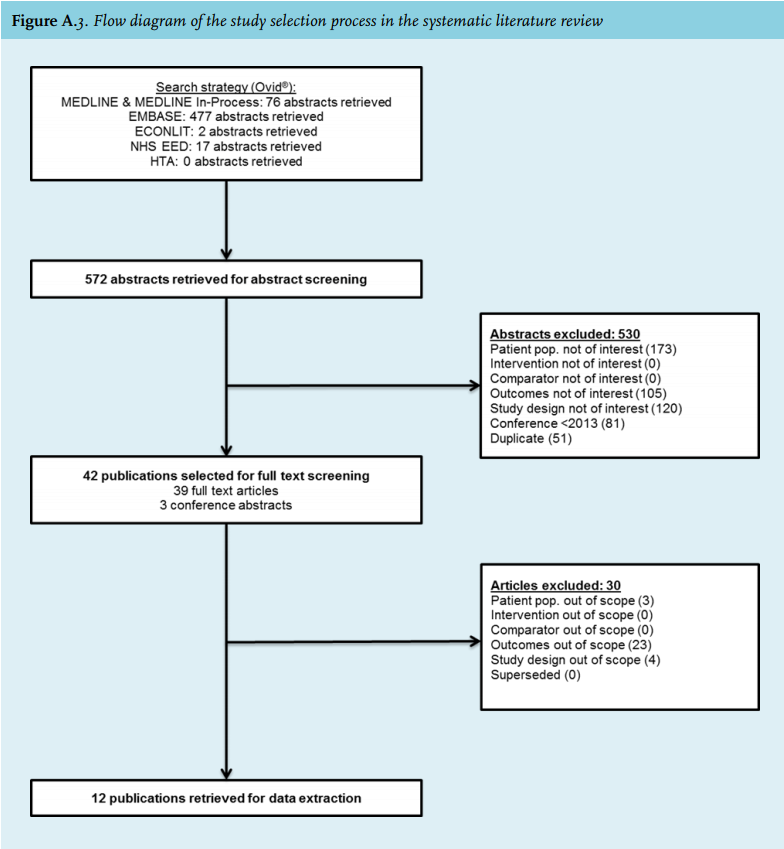
To identify all relevant published information, a SLR was conducted in accordance with the Preferred Reporting Items for Systematic Reviews and Meta-Analyses (PRISMA) guidelines.20 MEDLINE, EMBASE, ECONLIT, NHS EED and HTA databases were searched on 8 September 2015 (table A.1 in Appendix A). The search was restricted to records published from January 2010 onwards to ensure that the most recent data were included. Study selection took place based on pre-defined criteria regarding the population, outcomes and study design of interest (table A.2 in Appendix A). The population of interest consisted of T1DM or T2DM patients, and/or patients with microvascular or macrovascular DM complications of any grade. All studies reporting costs, resource use and work productivity in relation to the Netherlands were of interest. The SLR identified 572 records, of which 42 publications were retrieved for full-text screening and 12 studies were included for data extraction.21-32Figure A.3 in Appendix A shows the PRISMA flow diagram of the study selection process.20
In addition to the SLR, a targeted review was set up to search for relevant information in the grey literature. This search was performed during October and November 2015, and updated in May 2016. Three different types of information were of interest and for each type, different pre-selected sources were searched: 1) DM treatment guidelines;33-40 2) incidence and prevalence estimates of T1DM, T2DM and DM complications in the Netherlands;1,41-43 3) costs and resource use associated with DM and its complications in the Netherlands.1,14,15,18,19,41-49 Of these pre-selected sources, eight provided data that were used in the estimation of the current total economic burden.1,15,42-45,48,49 In addition, targeted searches were undertaken to fill any data gaps for which no information was identified in the SLR or the targeted review of pre-selected sources. Seven sources were used to fill data gaps.50-56
The evidence identified in the SLR and targeted review was then combined to estimate the current total economic burden of DM and its complications in the Netherlands. A detailed overview of the data used in the estimation is provided in tables B.1 to B.6 in Appendix B.
Estimation of DM incidence and prevalence
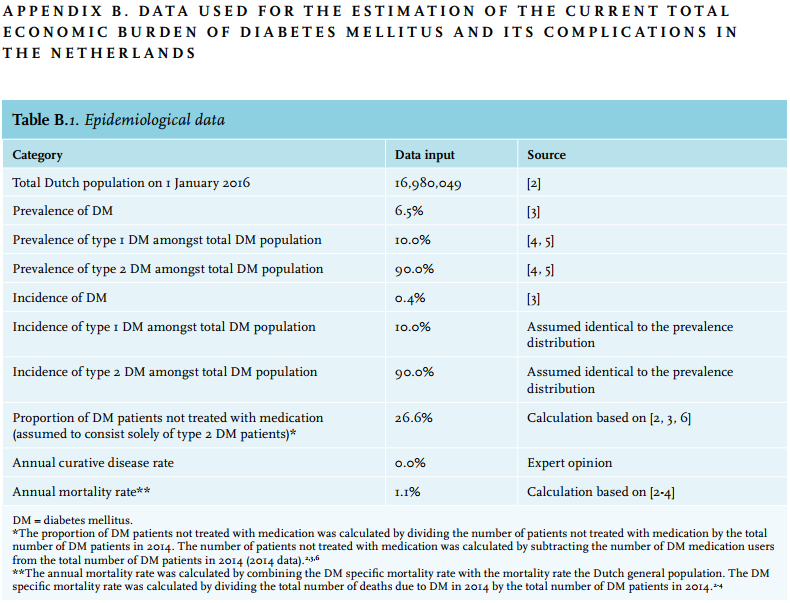
The number of DM patients in the Netherlands in 2016 was estimated based on the Dutch population size in 2016 and the DM prevalence rate in representative general practitioner (GP) practices.42,43 The estimate of the annual DM incidence was also based on these sources.42,43 The proportion of patients with T1DM and T2DM among the total number of DM patients was based on a website coordinated by the RIVM.1,57 The annual mortality rate for DM patients was estimated by combining the rate of DM-specific mortality and the mortality rate for the Dutch general population.1,42,43
Estimation of direct healthcare costs
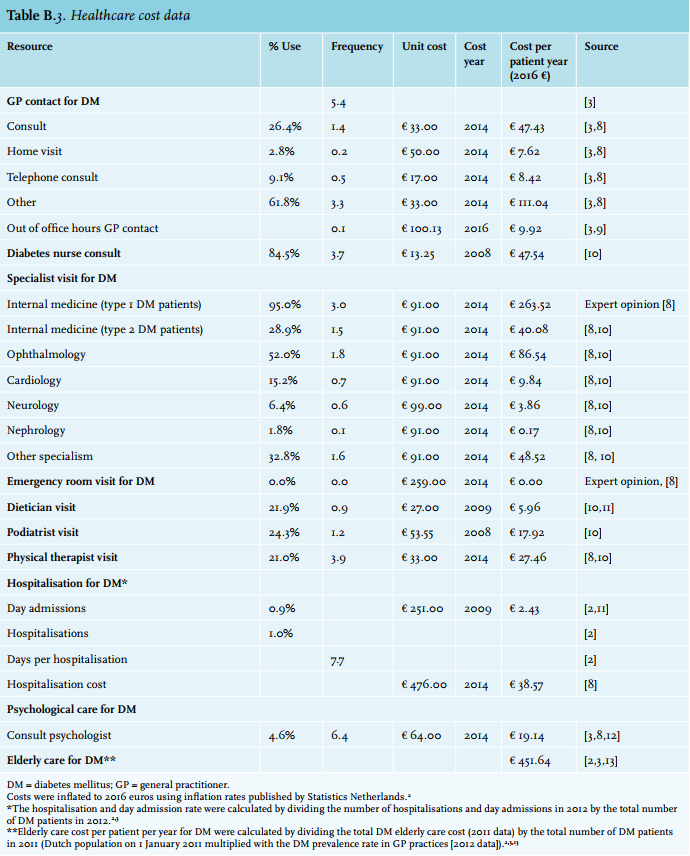
The estimation of direct healthcare costs included DM specific costs for medication, monitoring and treatment devices (including consumables), primary care, hospital care, mental care and elderly care.
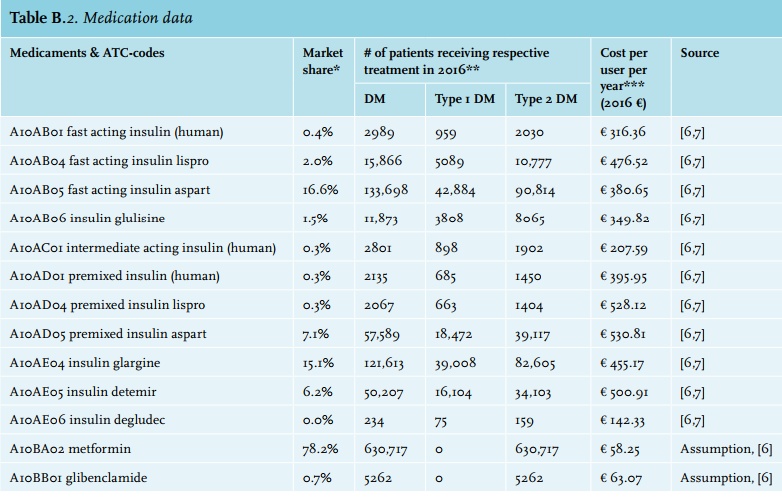
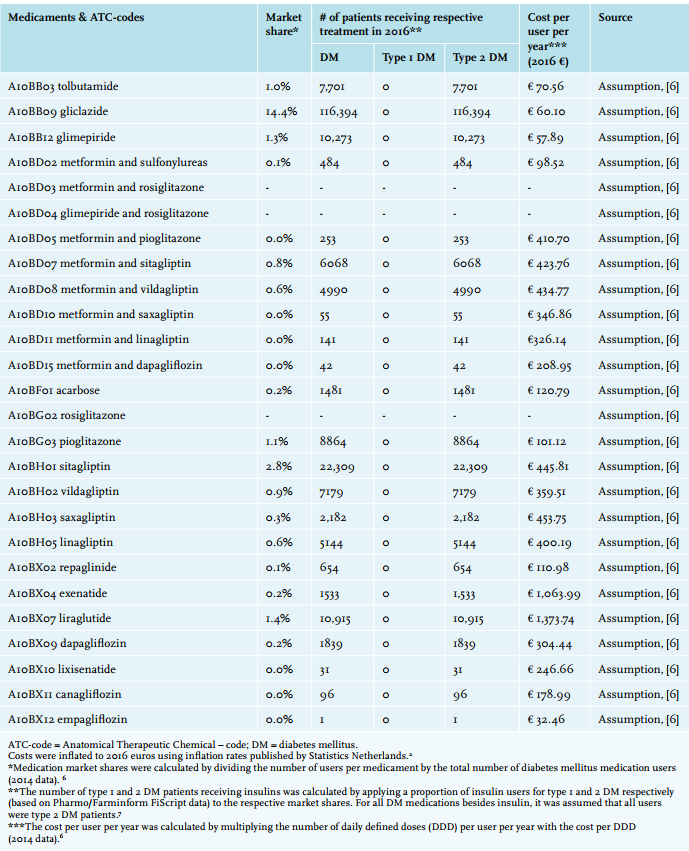
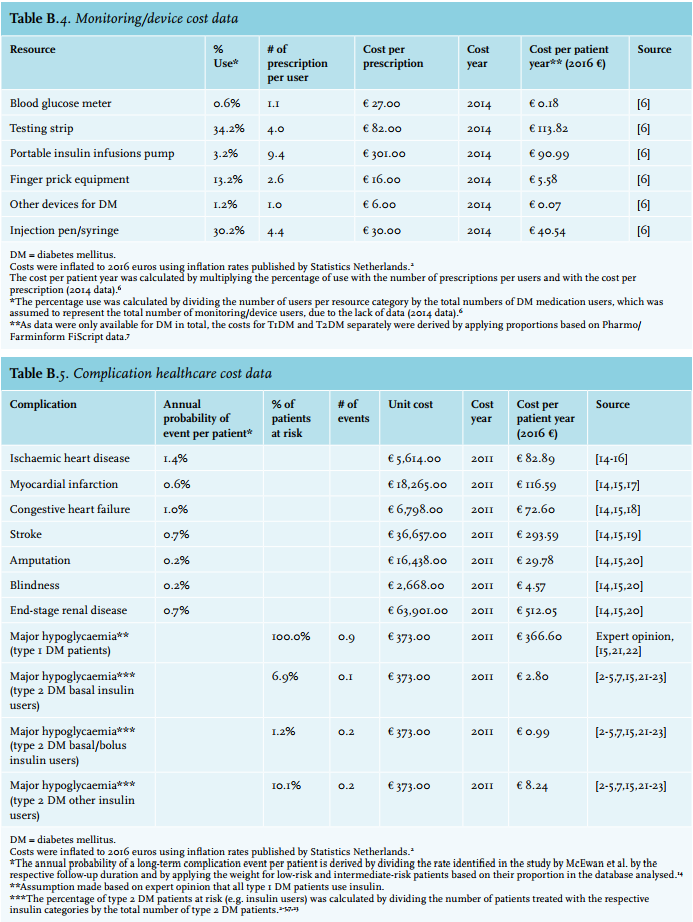
Medication costs were estimated based on the number of users per treatment, the number of daily defined doses (DDD) per user per year and the cost per DDD.15 Medication costs were only applied to the proportion of DM patients treated with medication, given that T2DM patients are initially treated with lifestyle and dietary advice.8 Therefore, the patients not treated with medication were considered to consist solely of T2DM patients, as T1DM patients would always be receiving insulin. The proportion of DM patients treated with medication was estimated based on the difference between the total number of DM medication users and the total number of DM patients.15,42,43 Because data were only available for DM in total, the number of insulin users for T1DM and T2DM separately was derived by applying a proportion based on FiScript data.15,55 Costs for other DM medications besides insulin were only applied to the population of T2DM patients.
The costs of monitoring, diagnostic and treatment devices (including consumables) were estimated based on the number of device users, the average number of prescriptions per user and the cost per prescription.15 These costs were only applied to the proportion of DM patients treated with medication, as these patients require stringent monitoring of their disease and they also use treatment devices (e.g. insulin pumps, syringes, injection pens), while patients solely treated with lifestyle and dietary advice do not. As data were only available for DM in total, the costs for T1DM and T2DM separately were derived by applying proportions based on FiScript data.15,55
Primary care costs included the costs of DM-related visits to GPs, DM nurses, dieticians, podiatrists and physical therapists. The costs of GP visits were estimated based on DM-specific resource use from representative GP practices and Dutch reference prices.43,48 For GP consultations occurring out-of-office hours, an average of the tariffs from all Dutch provinces was applied.49 DM nurse, dietician, podiatrist and physical therapist resource use was based on a study in T2DM patients by Van der Heijden et al.24 It was assumed based, on expert opinion (due to the lack of published data), that this was representative for the total DM population. Unit costs were based on Dutch reference prices or retrieved from this same study.24,48,58
Hospital care costs included the costs of DM-related medical specialist outpatient visits and hospitalisations. The costs of outpatient visits were estimated based on DM-specific resource use and Dutch reference prices.48 Resource use for visits to all medical specialists except internal medicine was based on Van der Heijden et al.24 Different resource use rates were applied for internal medicine outpatient visits, because of expected differences in treatment patterns between T1DM and T2DM. These were based on expert opinion (due to the lack of published data) for T1DM and data from Van der Heijden et al. for T2DM.24 The costs of DM-related hospitalisations and day admissions were estimated based on DM-specific resource use and Dutch references prices.48,58 Resource use for day admissions and hospitalisations was based on data published by Statistics Netherlands.42
Mental care costs were estimated based on resource use in T2DM patients, the average number of visits in representative mental care practices and the Dutch reference price.21,43,48 It was assumed, based on expert opinion (due to the lack of published data), that this resource use was representative for the total DM population.
Elderly care costs were included separately in the cost estimation, because the DM prevalence in nursing homes is two to three times higher than the prevalence in GP practices and approximately 15% of patients in nursing homes have DM, with more frequent macrovascular complications than in the overall DM patient population.59-62 Elderly care costs were included as a cost per patient per year, estimated based on the total DM elderly care costs for 2011 published by the RIVM and the total number of DM patients in 2011.42,43,45
Estimation of costs of complications
The direct costs of complications were estimated based on annual complication rates and the direct costs of the respective complications. The rates of long-term DM complications were based on an international DM registry, as no Dutch data were publicly available.50 As the registry only provided data for T2DM it was assumed, based on expert opinion (due to the lack of published data), that these were representative of the total DM population. The rate of major hypoglycaemia was based on Dutch data.51 All T1DM patients were assumed to use insulin and therefore at risk of major hypoglycaemia. For T2DM, the number of patients at risk (e.g. insulin users) was based on Pharmo and FiScript data.54,55 Direct costs of complications were based on a study by Van Haalen et al. in T2DM, which in turn retrieved cost data from several publications.27,63-68 The direct costs of a T2DM complication were assumed to be representative for the total DM population.
Estimation of indirect costs
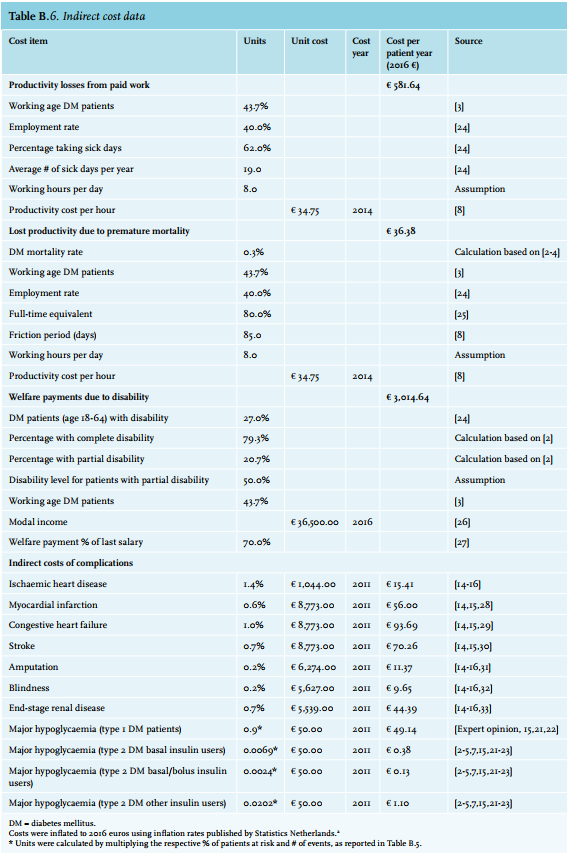
The estimation of indirect costs included productivity loss costs, welfare payment costs and indirect costs of complications. Productivity loss costs from paid work and due to premature mortality were included, and both were based on the percentage of working age patients, the employment rate, eight working hours per day and the reference cost for productivity per hour.43,48,56 Productivity loss costs from paid work were further based on the annual percentage of patients taking sick days and the average number of sick days taken.56 Productivity loss costs due to premature mortality were estimated using the friction cost method and further based on the rate of DM specific mortality, the full-time equivalent rate and a friction period of 85 days.1,30,42,43,48
Welfare payment costs were estimated based on the percentage of working age patients, the percentage of patients with disability, the proportion of patients with complete or partial disability, an assumed 50% disability level for patients with partial disability, the Dutch modal income and a welfare payment level of 70% of the last salary.42,43,52,53,56
For the estimation of the indirect costs of DM complications, the same complication rates were used as for the direct costs.50,51,54,55 The direct costs of complications included the medical costs associated with the complications of DM and travel expenses; the indirect costs of complications included the productivity losses associated with the DM complications based on the friction cost method.27,48 These indirect costs were included separately because absenteeism due to DM complications is often not linked back to DM itself. Indirect costs of complications were based on a study by Van Haalen et al., that in turn retrieved cost data from several publications.27,63,68-74 The indirect costs of a T2DM complication were assumed representative for the total DM population.
In the cases where data were only available for DM in total, the costs for T1DM and T2DM separately were derived by applying their respective proportion (T1DM: 10% of total; T2DM: 90% of total) to the total cost estimate for DM.1,57 All costs were inflated to 2016 euros based on the consumer price index published by Statistics Netherlands.42
RESULTS
DM incidence and prevalence
There were an estimated 1,098,609 patients with DM in the Netherlands in 2016 (table 1), based on a DM prevalence rate of 6.47% in representative GP practices in 2014 and on the population size of the Netherlands on 1 January 2016 (16,980,049 inhabitants).42,43 Of these patients, 10% (109,861 patients) were estimated to have T1DM and 90% (988,748 patients) to have T2DM.1,57 In accordance with the guidelines for T2DM, a substantial proportion of T2DM patients were considered to be initially treated with lifestyle and dietary advice and therefore not yet treated with medication,8 whereas all T1DM patients start insulin treatment immediately after diagnosis (table 1). The DM incidence rate was reported to be 0.36% in representative GP practices in 2014, amounting to 61,128 new DM patients in 2016, based on the size of the Dutch population in 2016.42,43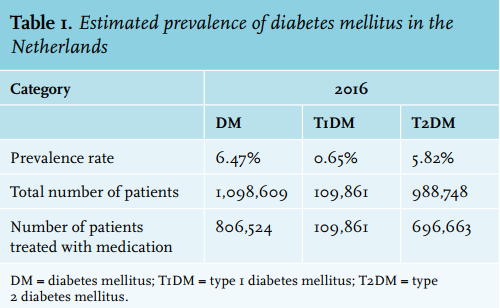
DM costs
The current total economic burden of DM in the Netherlands was estimated to be € 6.8 billion in 2016. For T1DM and T2DM separately, the current total economic burden was estimated to be € 873 million and € 5.9 billion, respectively (table 2).
Estimation of direct healthcare costs
The healthcare costs (excluding costs of complications) made up 23.1% (€ 1.6 billion) of the total costs for DM. The main cost drivers were elderly care costs (€ 496 million), primary care costs (€ 311 million) and hospital care costs (€ 277 million). For T1DM, the healthcare costs (excluding costs of complications) amounted to 35.5% (€ 310 million) of the total costs. The main cost drivers were monitoring/ device costs (€ 121 million), medication costs (€ 57 million), hospital care costs (€ 50 million) and elderly care costs (€ 50 million). For T2DM, the healthcare costs (excluding costs of complications) were 21.3% (€ 1.3 billion) of the total costs. The main cost drivers were elderly care costs (€ 447 million), primary care costs (€ 280 million) and hospital care costs (€ 227 million).
Estimation of costs of complications
The direct costs of complications made up 18.7% (€ 1.3 billion) of the total costs for DM. The most costly complications were end-stage renal disease (€ 563 million), stroke (€ 323 million) and myocardial infarction (€ 128 million). For T1DM, the direct costs of complications made up 20.8% (€ 162 million) of the total costs. The most costly complications were end-stage renal disease (€ 56 million), major hypoglycaemia (€ 40 million) and stroke (€ 32 million). For T2DM, the direct costs of complications amounted to 18.5% (€ 1.1 billion) of the total costs. The most costly complications were end-stage renal disease (€ 506 million), stroke (€ 290 million) and myocardial infarction (€ 115 million).
Estimation of indirect costs
For DM in total, the productivity loss costs amounted to 9.5% (€ 648 million) of the total costs, the welfare payment costs were 43.7% (€ 3.0 billion) and the indirect costs of complications 5.0% (€ 337 million). An estimated 129,625 DM patients received welfare payments. Of these, 102,793 (79.3%) had complete disability and 26,832 (20.7%) had partial disability. For T1DM, the productivity loss costs made up 7.4% (€ 65 million) of the total costs, the welfare payment costs were 34.0% (€ 297 million) and the indirect costs of complications 4.4% (€ 38 million). An estimated 12,962 T1DM patients received welfare payments. Of these, 10,279 (79.3%) had complete disability and 2683 (20.7%) had partial disability. For T2DM, the productivity loss costs amounted to 9.8% (€ 584 million) of the total costs, the welfare payment costs made up 45.1% (€ 2.7 billion) and the indirect costs of complications were 5.0% (€ 299 million). An estimated 116,662 T2DM patients received welfare payments. Of these, 92,513 (79.3%) had complete disability and 24,149 (20.7%) had partial disability.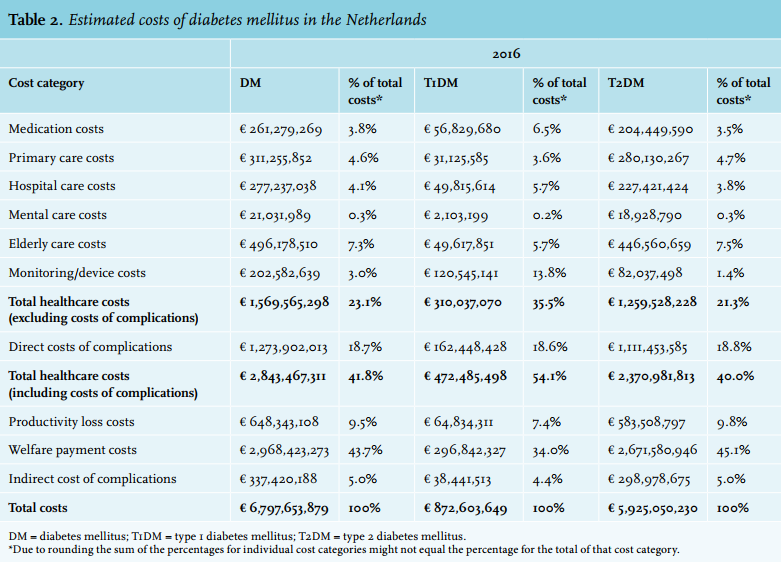
DISCUSSION
This study aimed to determine the current total economic burden of DM and its complications in the Netherlands to inform decision makers and payers. The total economic burden in 2016 was found to be substantial, with an estimated total cost of € 6.8 billion. More than half of this total cost (€ 4.0 billion) was attributable to indirect costs (productivity losses, welfare payments and complications), with welfare payments being the largest contributor to the indirect costs (€ 3.0 billion). Therefore, measures or strategies aimed at reducing these indirect costs could result in substantial cost-savings. Furthermore, the healthcare costs due to DM and its complications were € 2.8 billion (41.8% of the total cost), which constitutes approximately 3.0% of the total health expenditure in the Netherlands (€ 95.3 billion in 2015, no data available for 2016).42 Moreover, it is likely that the total economic burden of DM and its complications will rise further due to changes in demographics and lifestyle.2,10
The results of our study can be compared with those of previous studies. A study by Booz & Company on diabetes care in the Netherlands reported substantially higher medical and total costs (€ 4.5 and 10-11 billion in 2010 euros, respectively) than estimated in our study.16 It should be noted that the Booz & Company study has not been published in a nationally or internationally published peer-reviewed paper and that their results should therefore be interpreted with caution. The difference in medical costs can be explained by the inclusion of additional cost components (unreported costs of DM complications and other medical costs) in the Booz & Company study. Their estimate for welfare payment costs, a large portion of DM’s current total economic burden in this study, is comparable to ours. However, the productivity loss costs are substantially higher in the Booz & Company study (€ 3.5 billion in 2010 euros compared with € 648 million in 2016 euros), due to a difference in methodology. Our study used the friction cost method – where productivity loss costs are only applied during a friction period (e.g. the time it takes to replace someone in the workforce) – as recommended by the Dutch National Healthcare Institute,48 while the Booz & Company study utilised a human capital approach, in which the full cost of a Dutch annual modal income was applied to an estimated 98,000 disabled DM patients. The total healthcare costs (excluding costs of complications) from our study are somewhat lower than those published by the RIVM (€ 1.7 billion in 2011 euros), mainly driven by lower medication costs.45 Unfortunately, no information is provided on how the RIVM estimated medication costs, making it impossible to explain the difference. However, the cost estimate for DM medication in our study is in line with more recent estimates.15,18 Two recent studies estimated the total societal costs of DM in other European countries.75,76 A study by Hex et al. estimated the current and future economic burden of T1DM and T2DM in the United Kingdom (UK) based on aggregated datasets and the literature. The total cost of DM in the UK was £ 23.7 billion in 2011/2011, of which £ 9.8 billion were direct costs and £ 13.9 billion were indirect costs.75 When accounting for the roughly four times larger population size of the UK, the estimates for the total cost of DM are quite similar.42,77 Also, the proportions of the total costs attributable to direct and indirect costs, and T1DM and T2DM, respectively, are comparable. A study by Sortsø et al. aimed to provide a comprehensive real-world estimate of the societal DM-attributable costs in Denmark, based on national registry data. Unfortunately, no fair comparison with their results can be made, as they also included care not directly related to DM in their estimate, and not solely the cost of care for DM.76
The main strength of this study is the inclusion of all cost components that make up the current total economic burden of DM in the Netherlands, such as healthcare costs, costs of complications and indirect costs. Furthermore, the combination of a systematic literature review and a targeted review maximised the likelihood that all available evidence was identified. However, certain limitations of this study have to be noted. Firstly, the evidence identified was fragmented, requiring the use of several assumptions, the use of aggregated data and the combination of data from several sources. Secondly, because no single source could provide all the data required to estimate the current total economic burden, data from several sources had to be combined. Although care was taken to avoid double counting, the use of (aggregated) data from several sources inherently includes the risk that certain cost items may have been double counted. Thirdly, data for T1DM and T2DM separately were scarce, most sources only reported data for DM in total. Therefore, the estimation of the current total economic burden for T1DM and T2DM separately was predominantly based on the respective prevalence amongst the total number of DM patients (T1DM: 10% of total; T2DM: 90% of total).1,57 Despite this limitation, the separate results for T1DM and T2DM, although more uncertain than the results for DM in total, still provide valuable insight into the contribution of T2DM to the total economic burden for DM, which can inform health policy decisions, as T2DM is for a large part a preventable disease. Fourthly, this study only included costs for DM medications, while 85% of T2DM patients suffer from at least one other chronic condition at the time of diagnosis and 30% of DM patients have comorbid cardiovascular disease and 17.7% have comorbid chronic obstructive pulmonary disease.43,78,79 Therefore, the estimated € 2.8 billion in healthcare costs is most likely still an underestimation of the total healthcare costs accrued by DM patients. Finally, there were no Dutch publicly available data regarding the rates of long-term DM complications, requiring the use of data from an international DM registry.50
The results of this study highlight the increasing costs of DM associated with increasing DM prevalence. Initiatives aimed at preventing T2DM have been largely unsuccessful; however, such initiatives, if successful, would help to stem the rising costs. Furthermore, this study shows that the indirect costs related to productivity losses, welfare payments and complications account for more than half of DM’s current total economic burden. These indirect costs are mainly related to the long-term complications of DM and the disability that these cause. In addition to the substantial costs associated with these complications, they are also shown to have a significant impact on patients’ quality of life.2,5,6 These findings indicate that there is great potential for gain, both in terms of cost savings and improvements in patients’ quality of life, by reducing the occurrence of the long-term complications of DM. For example, improvements in the management of DM and adherence to medication from early in the course of the disease will lead to better long-term glycaemic control and DM-related complications.80
CONCLUSION
Diabetes mellitus and its complications pose a substantial economic burden to the Netherlands, with the burden expected to rise further due to changing demographics and lifestyle. Indirect costs, such as welfare payments, accounted for a large portion of the current total economic burden of diabetes mellitus, while these cost components are often not included in cost estimations. Publicly available data for key cost drivers such as long-term complications were scarce.
DISCLOSURES
Mapi Group was financially supported by Novo Nordisk to perform the study. M.L. Peters is a Mapi employee and served as a paid consultant to Novo Nordisk during the conduct of this study; E.L. Huisman and M. Schoonen are Novo Nordisk employees; B.H.R. Wolffenbuttel has received grant support for clinical studies and also consulting fees for serving on advisory boards and as a speaker for Amgen, Astra Zeneca, Eli Lilly and Company, Novo Nordisk, Pfizer and Sanofi. He has also received consulting fees from Eli Lilly and Company as a member of the 4B study and of the DURABLE Trial Data Monitoring Committee.
REFERENCES
REFERENCES FOR APPENDIX