KEYWORDS
Bone turnover markers, combination antiretroviral therapy, HIV-infection, immune activation, osteoporosis, T-cell activation
INTRODUCTION
A higher risk of developing osteopenia (6.4 fold) and osteoporosis (3.6 fold) has been seen in HIV patients compared with uninfected controls,1 with a prevalence of 52% and 15% respectively.2 Not only the traditional risk factors that are more prevalent among HIV-infected patients, such as low body mass index, smoking, alcohol abuse and glucocorticoid therapy, but also HIV-related risk factors, such as HIV-viral load, nadir CD4+ T-cell count, combination antiretroviral therapy (cART) use and immune activation, contribute to this low bone mineral density (BMD).3-5
However, recently published contradictory data showed that after correction for traditional risk factors, no association with BMD was found in HIV-infected patients, compared with uninfected controls.6
HIV-induced immune activation is thought to promote osteoporosis through activated T cells.7-9 In HIV-infected patients an increased T-cell activation (defined as CD38 and HLA-DR positivity) is seen, even in those suppressed (HIV-RNA viral load < 50 copies/ml) by cART.10 Two studies, however, found no significant relation between activated CD38+HLADR+ T cells or inflammatory markers and BMD in HIV-infected patients.11,12 In these studies not all patients were on cART, making interpretation for the majority of suppressed HIV patients difficult.
Bone remodelling is a continuous coordinated process of osteoclast resorption and osteoblast formation.13 The bone turnover marker c-terminal telopeptide (CTX) can be used to measure bone resorption and procollagen type 1 amino-terminal propeptide (P1NP) for bone formation.14 Here we present a pilot study investigating the relation between BMD and either T-cell activation or bone turnover markers by comparing these in HIV-infected cART-treated male patients above 50 years of age with osteopenia/ osteoporosis (T-score below -1) to those with a normal BMD (T-score above -1).
MATERIALS & METHODS
Patients
HIV-infected patients were recruited from the University Medical Centre Utrecht (UMCU) for participation in the OASIS-HIV study. All patients were previously enrolled in the ‘A Phase 4 Cross-Sectional Study of BMD in HIV-1 Infected Subjects’ study (ID:GS-US-104-0423; ClinicalTrials.gov:NCT01850212), where they underwent dual energy X-ray absorptiometry (DEXA) scanning to quantify bone loss and measure BMD. All patients provided written informed consent in accordance with the Declaration of Helsinki and the local Medical Ethics Committee approved the study.
Study design
The OASIS-HIV study was a cross-sectional single visit study where blood was drawn for further comprehensive in-depth immunological analysis. Data of the previous DEXA scan, performed approximately six months earlier, was used for classification of patients into two groups: osteopenia/osteoporosis (T-score below -1) and normal BMD (T-score above -1). The T-score was measured in the lumbar spine, hip and femoral neck using the DEXA scan. Osteoporosis and osteopenia was classified as a T-score below -2.5 and -1 respectively in one or more locations on the DEXA scan.
Laboratory measurements
Blood samples were obtained by venous puncture, with collection and isolation of plasma and peripheral blood mononuclear cells (PBMCs) performed within four hours at the immunology lab of the UMCU. Plasma was frozen and stored at -80 °C until all the samples were collected. They were then sent to the laboratory of Medicine and Bone Metabolism at the UMC Groningen for analysis of bone markers (CTX and P1NP), as described previously.15 For these markers Z-scores were used, based on more than 350 gender- and age-matched uninfected controls.15 These were volunteers working at the UMC Groningen, the Netherlands. To mathematically calculate net bone formation CTX was subtracted from P1NP. The HIV-RNA viral load was measured (COBAS® AmpliPrep/ COBAS® TaqMan®, Roche Diagnostics, Indianapolis, USA) with a lower limit of detection of 50 copies/ml.
PBMC processing, cell staining and flow cytometric analyses
PBMCs were isolated using Ficoll-Paque™ Plus (GE Healthcare) density gradient centrifugation and washed with RPMI 1640 culture media (Gibco®, life technologies™) containing 5% foetal calf serum (FCS) and penicillin-streptomycin before being cryopreserved with RPMI 20% FCS. Cryopreserved PBMCs were thawed with RPMI 20% FCS and subsequently used for flow cytometric analysis. Cells were washed using PBA (Sigma®, Life Science), stained with cocktails of monoclonal antibodies and left to incubate for 20 min at 4°C. Fluorescence minus one controls were used to define positive gates for the expression of different proteins. Lymphocytes and monocytes were gated based on forward and side scatter using a FACS LSR Fortessa (BD Biosciences, Franklin Lakes, USA) and FACS Diva software version 8.0 (BD Biosciences, Franklin Lakes, USA).
Data analyses
The primary outcome of this study was the relation between BMD (osteoporosis/osteopenia versus normal) and either T-cell activation or bone turnover markers. Secondary outcomes were the association of patient characteristics with BMD. A Mann-Whitney test was used to compare non-paired continuous variables. Data were presented as percentages for categorical variables and as median with interquartile ranges (IQR) for continuous variables. Differences were considered statistically significant when p < 0.05. Linear regression modelling was used to evaluate the relation between BMD and T-cell activation or bone turnover markers and the association with patient characteristics. Analyses were performed using SPSS version 21 (SPSS, Chicago, Illinois, USA).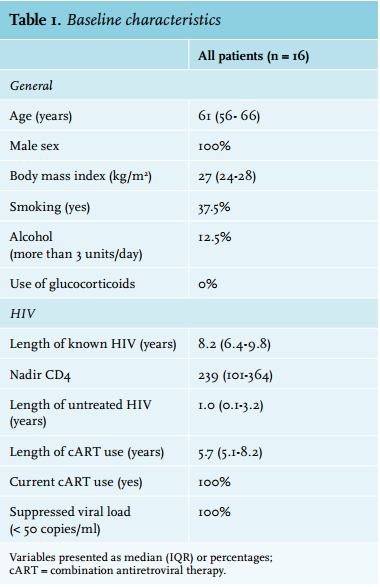
RESULTS
For this pilot study we enrolled 17 out of the 20 patients previously enrolled in GS-US-104-0423, as three patients objected to study participation. To increase the homogeneity of the group, one patient was excluded, as she was female, resulting in 16 patients, all male, with a median age of 61 years (IQR 56-66).
Osteoporosis was diagnosed in 3 patients (19%), osteopenia in 6 patients (38%) and a normal BMD was found in the remaining 7 patients (44%) (table 1). When looking at the specific measuring sites the prevalence of osteoporosis was 12%, 0% and 6% for the lumbar spine, hip and femoral neck respectively. For osteopenia this was 25%, 31% and 44% respectively. None of the patients were using osteoporosis medication at the time of the study.
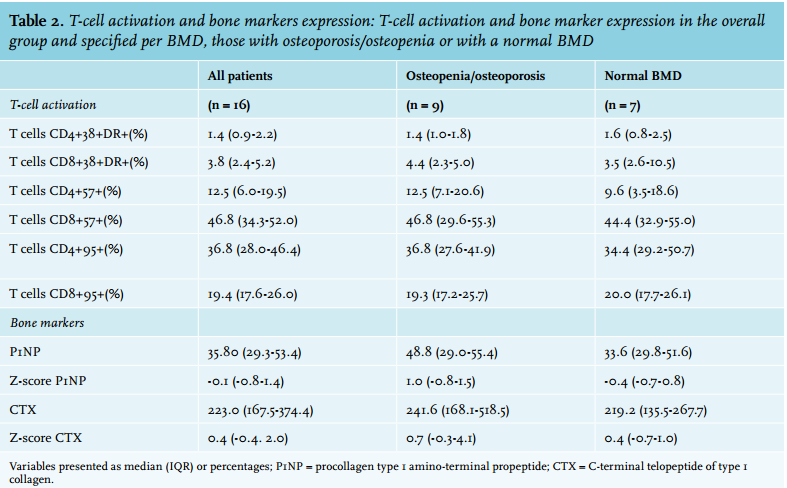
First, we analysed the association of T-cell activation, defined by CD38+HLA-DR+ positivity, with bone pathology. The overall CD38+HLADR+ expression was 1.4% (IQR 0.9-2.2) for CD4+ and 3.8% (IQR 2.4-5.2) for CD8+ on T cells. No differences were seen between patients with osteoporosis/osteopenia (T-score below -1) and normal BMD (T-score above -1) for either CD4+ (1.4% versus 1.6%, p = 0.95) or CD8+ T cells (4.4% versus 3.5%, p = 0.69) (figure 1A+B). Similarly, no differences in senescence were seen between the groups (table 2). Furthermore, no relation for T-cell activation with BMD was found using linear regression (CD4+: β 0.03, 95% CI -0.84;0.90, p = 0.95 and CD8+: β -0.01, 95% CI -0.16;0,14, p = 0.87).
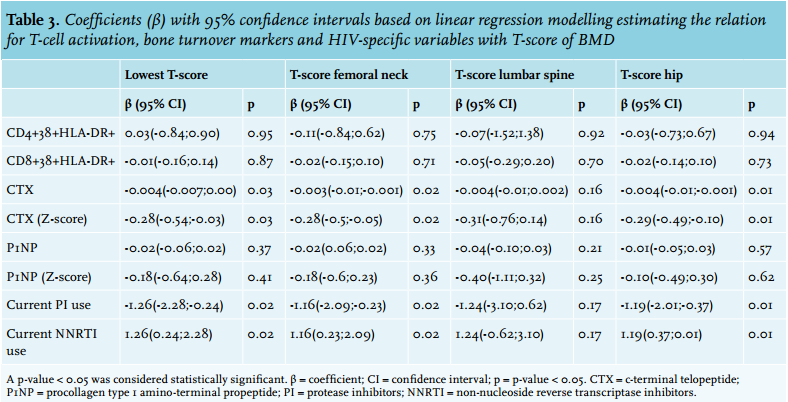
Next, we analysed T-cell activation in relation to the bone turnover marker CTX and bone resorption marker P1NP. No relation between T-cell activation and bone markers was found to depict the net bone formation (data not shown), even when subtracting CTX from the P1NP. However, CTX itself was inversely correlated with BMD (β -0,004, 95%CI -0.007;0.00, p = 0.03) (figure 1C). Furthermore, higher levels of P1NP (figure 1D), though not significant (β -0.02, 95% CI -0.06;0.02, p = 0.37), were found in patients with a lower BMD. No difference between patients with osteoporosis/osteopenia and those with a normal BMD was seen for CTX (0.65 versus 0.37, p = 0.30) and P1NP (0.97 versus -0.35, p = 0.61).
When analysing the effects of cART on bone formation and resorption, a relation was seen between higher bone formation (P1NP) and patients on cART for longer (β 0.26, 95% CI 0.0;0.46, p = 0.01) (figure 1E). The median length of cART use was 5.7 years (IQR 5.1-8.2), with all patients on nucleoside reverse transcriptase inhibitors (NRTIs), 88% on tenofovir, 63% on non-nucleoside reverse transcriptase inhibitors (NNRTIs) and 38% on protease inhibitors. On a similar note, osteopenia/osteoporosis was seen in 100% of the patients on protease inhibitors versus 30% of those on NNRTIs. A positive relation for current NNRTI use with BMD was seen (β 1.26, 95% CI 0.24;2.28, p = 0.02), whereas current use of protease inhibitors was related to a lower BMD (β -1.26, 95% CI -2.28;-0.24, p = 0.02). A relation between BMD and tenofovir could not be analysed, as only two patients were not on tenofovir.
Table 3 not only shows the linear regression results for the lowest T-score, it also shows the association of the above-mentioned variables per DEXA measured region, femoral, lumbar spine and hip respectively. No differences were seen per region or as a whole (table 3).
DISCUSSION
The postulated mechanism of how HIV-induced immune activation promotes osteoporosis is via the replication of the viral protein gp120, which is present on the HIV envelope or possibly through the increased production of receptor activator of nuclear factor kappa-B ligand (RANKL) by activated T cells.7-9 Although suggested in previous publications, our pilot study could not confirm a possible role for activated T cells in the pathogenesis of osteoporosis, as no association was found.16,17 This could possibly be explained by the relatively low level of T-cell activation, 1.4% and 3.8% respectively for CD4+ and CD8+ T cells as found in our study of cART-treated patients with a supressed viral load. Previously published studies showed a more than 2.5 fold higher prevalence for activated CD4+ and CD8+ T cells in similarly cART treated HIV-infected patients with a supressed viral load.10,18,19 Our prevalence is similar to that of HIV-negative patients, which is 1-2.2% and 1-5.1% for CD4+ and CD8+ T cells respectively.10,18
In this study we did, however, find an inverse correlation for the bone turnover marker CTX, a bone resorption marker, and BMD. In untreated HIV-infected patients, higher levels of CTX correlated with advanced HIV disease, which returned to levels of uninfected controls upon initiation of cART.20-22 In addition, increased levels of bone turnover markers predicted BMD decreases in HIV.23 However, CTX has also been shown to increase upon initiation of cART, reaching a stable, but higher plateau compared with cART-naïve patients with high CD4 T cells.24 We also found a correlation for P1NP, a bone formation marker, and BMD. This observation is expected as the bone formation increases due to increased resorption and its subsequent production of growth factors.25 Despite its small sample size, several of our study outcomes strengthen our observation. First, the prevalence of both osteoporosis and osteopenia in our study patients was representative for other published HIV populations.2,26-29 Second, an even distribution of our data was seen upon linear regression, meaning the data were not skewed to an outlier (figure 1). Finally, we also increased our homogeneity by only including male patients over 50 years of age. Therefore, we think that a larger sample size would not influence the conclusions of our study.
The question then remains how to explain the increased prevalence of osteoporosis in HIV, as activated T cells do not seem to influence its pathogenesis. It is well known that HIV-infected patients have higher incidences of classic osteoporosis risk factors, such as alcohol abuse and smoking compared with the general population possibly contributing to this higher prevalence.3,5,30 Furthermore, the increase could be explained by the activation induced at the start of the HIV infection. In a study performed in primary HIV infection, an increased prevalence was already seen in their population with a mean age of 38 years, compared with HIV-negative controls. Thus, possibly alluding to a role for viral load, as a high viral load has been known to correlate to lower BMD.31 Most likely it is a multifactorial problem not caused by just one but several HIV-related components.
Another known component is cART; upon starting cART the BMD is known to decrease.24 In this small pilot an effect of cART on BMD was also seen, with a possible negative effect for protease inhibitors and a possible protective effect for NNRTIs. Previous studies have reported on the possible negative effect of protease inhibitors, especially correlated to time on therapy containing protease inhibitors.28,29 For NNRTIs, negative effects have also been reported, especially in the lumbar spine in patients of an older age with a low body mass index,26,27 contrary to what we have found. Therefore, the effect of NNRTIs on BMD warrants further investigation. In conclusion, this pilot study could not confirm a possible role for activated T cells in the pathogenesis of osteoporosis. However, cART seems to influence BMD, with a possible negative effect for protease inhibitors and a possible protective effect for NNRTIs.
DISCLOSURES
Previously presented as a poster at the Netherlands conference on HIV pathogenesis, epidemiology, prevention and treatment (NCHIV) 2015.
Funding: This study was supported by an unrestricted grant from Will-Pharma (Zwanenburg, the Netherlands). Conflicts of interest: None.
REFERENCES