KEYWORDS
HCV disease burden, HCV epidemiology, HCV treatment, prediction model, the Netherlands
INTRODUCTION
Chronic hepatitis C virus (HCV) infection is a major cause of chronic liver disease. It causes liver fibrosis and may ultimately lead to liver cirrhosis, hepatocellular carcinoma and death.1 It has been estimated that there are around 80 million people worldwide with chronic HCV infection.2 There is a large geographical variation in prevalence of HCV infection and in many countries the epidemiology of HCV infection is not well known. At the same time, HCV-related mortality continues to increase as the infected population ages3 and the infected population advances to late-stage liver disease.4-6 Recently, the World Health Organisation (WHO) recognised viral hepatitis as a global public health problem,7 and asked countries to develop comprehensive national viral hepatitis strategies.8
In the Netherlands, estimates on antibody prevalence of HCV infection vary from 0.1 to 0.6%.9-13 The most recent and reliable nationwide estimate was 0.22% (0.07%-0.37%) in Dutch habitants aged 15-79 years in 2009, incorporating prevalence data among different subpopulations,9 corresponding with about 28,000 adult individuals ever infected with HCV. Assuming a spontaneous clearance rate of 26%,14 around 20,000 of them are or have been viraemic. This corresponds to a viraemic prevalence of 0.13% in the total Dutch population. The risk groups of individuals with a known viraemic HCV infection (relatively many (ex-)drug users) are different from the groups of individuals currently at risk of a new HCV infection (strikingly almost no drug users, but mainly HIV-positive men who have sex with men). This situation is different in the Netherlands compared with many other countries where HCV transmission among people who inject drugs is ongoing. Importantly, the undiagnosed population might be substantial due to the symptom-free course in approximately 80% of cases.15 A study from the southern region of the Netherlands indicated that 66% of HCV infections are hidden to current screening practices (‘hidden population’).16
With the availability of new powerful peginterferon-free treatment modalities in sight, treatment of HCV will become more effective and have fewer side effects. As a result, the barriers for starting treatment are expected to be lower and more patients will be treated. Following the recommendations of the WHO, it is important to develop a strategy to diagnose the ‘hidden’ HCV-infected population in the Netherlands in order to be able to benefit from the treatment advances. However, reliable data on epidemiology and understanding of disease dynamics and barriers to HCV screening and treatment are needed before robust plans can be made.
The aim of this study was twofold:
This study is part of a larger project to quantify HCV epidemiology in a systematic manner in countries around the world, and for which the same prediction model has been used.2,6,17 In our report we focus on the situation in the Netherlands.
METHODS
Baseline population characteristics
Inputs
A systematic review of the literature was conducted to identify studies reporting the total number of HCV cases diagnosed, treated and cured in the Netherlands. Indexed articles were found by searching PubMed and Embase. The review encompassed all studies between January 1990 and July 2013. Non-indexed sources were identified through Ministry of Health websites and reports from international agencies. As described in detail in an earlier published study,18 this literature search was combined with face-to-face discussions with a panel of experts (consisting of epidemiologists, hepatologists, infectious disease specialists, public health professionals and virologists) to gather epidemiological data and consensus estimates. The obtained data were used to estimate the historical number of new HCV infections per calendar year.
Model
A disease progression model was constructed in Microsoft Excel® (Microsoft Corp., Redmond, WA) to quantify the size of the HCV-infected population by liver disease stages (METAVIR score F0-F4), from 1950-2030. The model was set up for sensitivity and Monte Carlo analysis using Crystal Ball®, an Excel® add-in by Oracle®. Beta-PERT distributions were used for all uncertain inputs. The Excel® optimisation add-in, Frontline Systems’ Solver, was used to calculate the number, age and gender distribution of the annual acute HCV infections which progressed to chronic HCV infection after accounting for spontaneous clearance of the virus (figure 1).6 The model was validated in countries where annual hepatocellular carcinoma incidence and liver-related deaths were reported.6,17 The progression of these new cases was followed along with all chronic infections from prior years. Unless specified, the scope of the model was limited to HCV-viraemic (ribonucleic acid (RNA) positive) cases. Non-HCV-viraemic cases (those patients who spontaneously cleared the virus or were treated and cured) were not considered even though they would test positive to HCV antibodies and may still progress to more advanced stages of liver disease despite viral clearance.19 In addition, re-infections following spontaneously or treatment-induced clearance were not considered as it was not possible to add this factor to the prediction model we used. The total number of cases, at each stage of the disease, was tracked by age and gender. Five-year age cohorts were used up to age 84; those aged 85 and older were treated as one cohort. Each year, one fifth of the population in each age group, except for those 85 and older, was moved to the next age cohort to simulate ageing.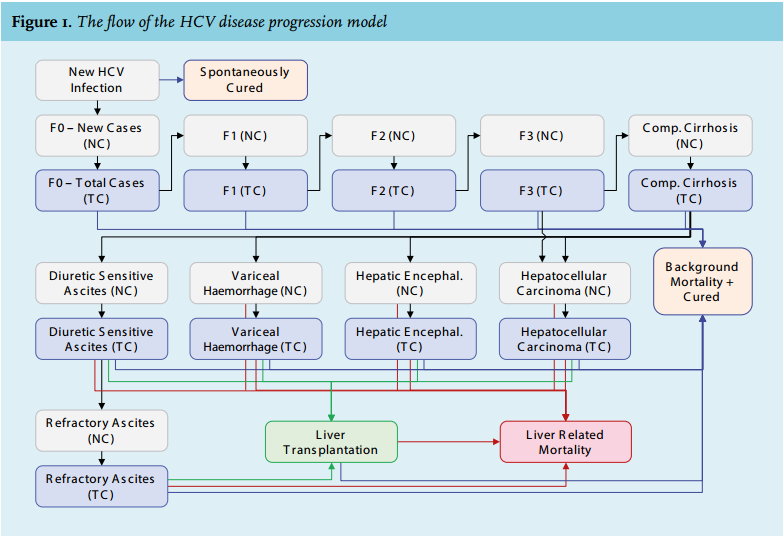
Estimation of chronic and new HCV infections
Prevalence of HCV infections
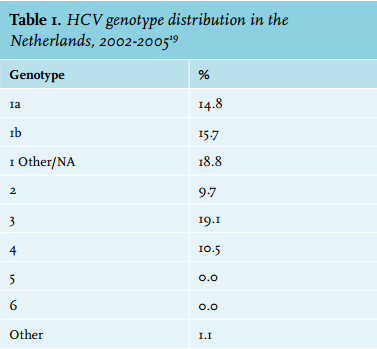
Available data were used to estimate the number of adults living with an HCV-RNA positive infection in the Netherlands. The paper we used for estimating anti-HCVantibody prevalence was chosen because it was the most recent estimate and had the best representation of the overall population in the Netherlands.9 There were no reliable age and gender distributions available for the Netherlands but the median age was reported at 54 years in 2006-2007,10 slightly younger than in the Unites States.20 In addition, United States and Dutch gender ratios were considered comparable, as well as the timing of the peak infections,9,20,21 so the Dutch age and gender distributions were established using the United States as an analogue (figure 2). Dutch population data were obtained by five-year age and gender cohorts from the United Nations population database, which uses the data registered at the Dutch central bureau for statistics (Statnet).22 The genotype distribution (table 1) was established using data from an analysis of patient data collected between 2002 and 2005 from 53 hospitals in 11 of the 12 Dutch provinces.23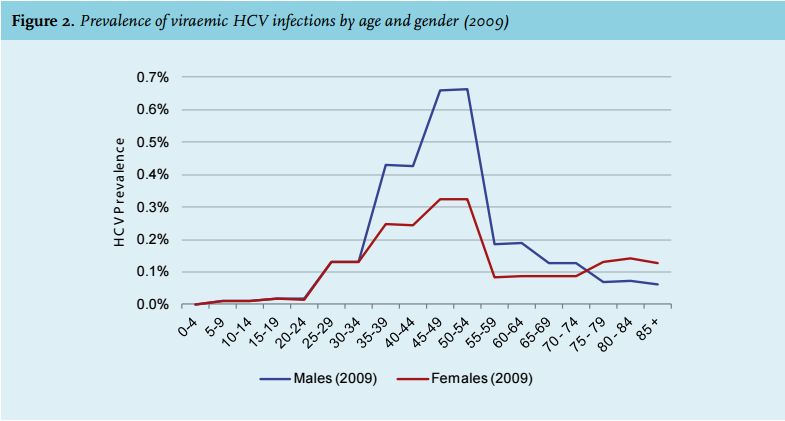
Diagnosed HCV infections
The annual number of newly diagnosed HCV cases ranged from 400 to 800 according to the expert panel. This range was based on different recent and less recent reports. One of these data sources is the compulsory reporting system for new HCV infections from 1999 to 2003, in which 600 to 700 new infections were reported per year (3.9-4.1 per 100,000 inhabitants).24 Another data source is the information system of Dutch microbiology laboratories reporting the number of positive HCV tests per year. Not all laboratories participate, giving an underestimation, but there are also patients tested more than once per year, which may compensate for this underestimation. From 2005 to 2010 there were 700 to 900 diagnoses per year, and from 2011 to 2014 the number declined to 380 diagnoses per year.25 By 2013, it was estimated that 12,000 individuals were diagnosed (an average of 600 newly diagnosed cases per year over 20 years). In 2013, based on estimations of the expert panel in combination with data in the literature, it was estimated that 650 individuals were newly diagnosed with HCV viraemia.
New HCV infections
The annual number of new cases (i.e. acute HCV infections and new chronic HCV infections due to immigration) has not remained stable since 1950. Thus, an annual relative incidence value was used to describe the change in the number of new infections over time. Relative incidence was set to 1 in 1950 and based on discussion with the expert panel, taking into account the risk factors common in the Netherlands over time (nosocomial infections before 1992, injection drug use, etc.), it was estimated that the number of new infections peaked in 1989 and gradually declined thereafter. In 2013, 62 new cases of acute HCV infection were notified to the National Institute of Public Health and the Environment (RIVM). Of these cases only two were reported to be due to injecting drug use26 and an earlier study performed in 1999 to 2001 showed that 6% of all new HCV cases were attributable to injecting drug use.24 In line with these findings, cohort studies show a very low incidence.27 Therefore, in the model the annual number of new cases due to injecting drug use was considered low. In the Netherlands, as in many other countries, transfusion of blood products has not been considered a risk factor for new HCV infections since 1992, as donor blood screening started in 1991. A linear declining rate was applied to get the percentage of total infections attributed to transfusion to zero by 2030. The annual number of new cases due to immigration was calculated by gathering net annual immigration, by country of origin and the corresponding anti-HCV prevalence in the country of origin. Based on the immigration data the numbers increase from 1995 until 2011, and then stay constant from 2011 onwards (see notes in table 2 for more details).2 Another group with a high risk of a new HCV infection is the group of HIV-positive men who have sex with men (MSM). Of the 362 newly reported HCV infections in 2013, 155 were among HIV-positive MSM.28 The risk of re-infection is considered low among people who inject drugs29 but substantial among MSM30 in the Netherlands. However, in the model we used, it was not possible to consider re-infections. The model calculated the annual number of all-cause and liver-related deaths and the cured cases as described below. 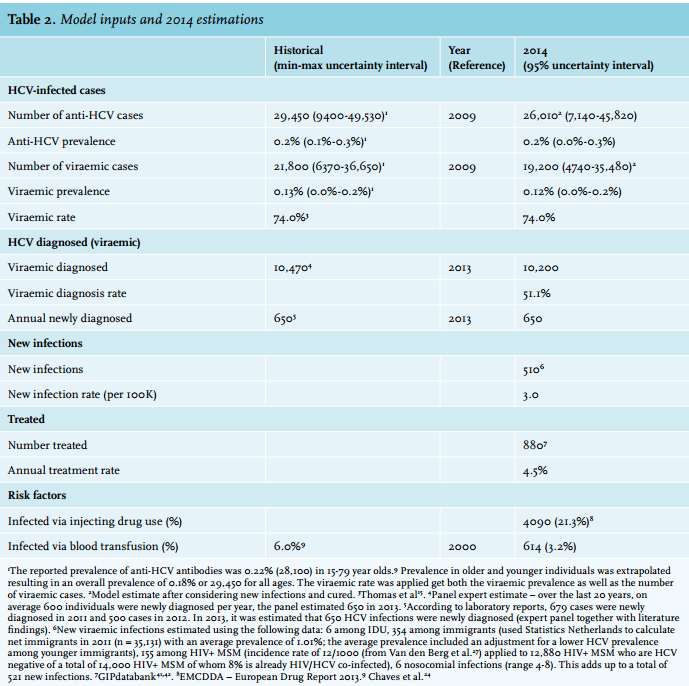
Progression rates
Disease progression by age and sex was simulated by multiplying the total number of cases at a particular stage of the disease by a progression rate to the next stage. The rates were gathered from previous studies5,12,31-37 or calculated using known numbers from Dutch national reports. Liver transplant data were available through the Eurotransplant Statistics Report Library and from the individual transplant centres in the Netherlands. In 2013, there were 142 liver transplants performed in the Netherlands.38 Of all liver transplants 12% are attributable to HCV infection each year (a frequency of 11-13% over the past 12 years, based on personal communication with the three transplant centres in the Netherlands). The total number of cases was adjusted for ageing, all-cause mortality and proportion of cured HCV infections in any given year.
All-cause mortality
The all-cause mortality rates by age and gender were gathered from the Human Mortality Database.39 Mortality rates were adjusted using standard mortality ratios among people who inject drugs and individuals who have received blood products.40
Treated and cured
Analysis of ribavirin units sold (for chronic or acute HCV infection) was used to estimate the total number of treated HCV patients in the Netherlands.41,42 In 2013, this number was 880. It was assumed that the number of treated patients stayed constant after this last reported year (2013). It was also assumed that the number of treated patients for each genotype was proportional to the genotype distribution of the HCV-infected population.
The annual number of cured patients was estimated using the average sustained viral response (SVR) rate of the different treatments in a given year (SVR rates were based on available literature).43-45 A separate SVR was used for the major genotypes, as shown in figure 3. A weighted average of different treatment options in a given year was considered (dual therapy with peginterferon and ribavirin or triple therapy with peginterferon, ribavirin and a direct-acting antiviral (DAA)). The number of cured patients from all genotypes was summed by stage of the disease and we assumed that the numbers were equally distributed among eligible age cohorts. 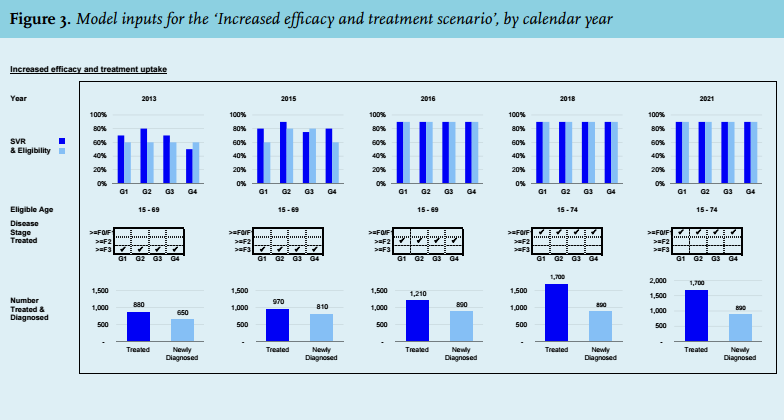
Treatment protocols and strategies
The model interface allowed for changing assumptions for the number of patients treated, the proportion of cases eligible for treatment, the reduction in treatment restrictions, the average SVR rate by genotype, the number of newly diagnosed individuals and the number of new infections at five different points in time. The year in which these changes were observed was also an input field. The different new therapies considered were: DAA + peginterferon + ribavirin, DAA + ribavirin (interferon-free) and all-oral DAA combinations with or without ribavirin. For the model, we assumed that all changes took effect immediately. The co-existence of multiple therapies was handled by modifying the average SVR.
The pool of patients who could be treated was impacted by explicit or implicit treatment protocols. According to the literature, approximately 40-60% of HCV patients are eligible for peginterferon /ribavirin.43-45 The definition of eligibility includes contraindications to the drugs as well as patient preference. In this analysis, 60% of the patients were considered eligible for standard-of-care treatment (figure 3), being peginterferon + ribavirin for genotype 2 to 6 and peginterferon + ribavirin + DAA for genotype 1.
When peginterferon could be eliminated, the eligibility was increased. We assumed that the increase in eligibility would not directly increase the number of patients treated in the future. However, we assumed that it did increase the pool of diagnosed and eligible patients who could be drawn upon. Any changes in treatment were implemented using a separate input.
The future number of treated patients was capped by (I) the number already diagnosed, (II) number eligible, and (III) unrestricted cases, related to implicit (defined by physicians’ practice) and/or explicit (defined by treatment guidelines) restrictions. These restrictions could be modified by changing the upper and lower end of patient age and their stage of fibrosis (F4 (Child-Pugh A, B or C), F3, F2, or F1/F0). Review of the treatment guidelines and interviews with the expert panel were used to identify both of these factors. Decompensated cirrhotic patients were considered ineligible for peginterferon-containing therapies (irrespective of genotype). The fibrosis stages eligible for treatment are shown in figure 3. When the number of treated patients was greater than those diagnosed, eligible and unrestricted, the number of newly diagnosed cases was increased or the treatment restrictions were loosened. The focus of the analysis was to highlight how many cases have to be diagnosed to achieve a treatment strategy rather than to forecast the screening capacity.
Scenarios
Multiple treatment strategies were considered and are described below: base scenario, increased efficacy only, increased efficacy and treatment uptake, screening and elimination, and focused treatment of individuals with different fibrosis stages. Scenario inputs, including SVR, fibrosis stage and medical eligibility, divided by genotype and year, are shown in figure 3. The numbers of treated and diagnosed patients necessary to achieve the desired scenario outputs are also shown.
In all instances, HCV-viraemic infections represented all current HCV infections (acute and chronic HCV infections). The term viraemic was used throughout this study to highlight the presence of HCV-RNA. The term incidence was used for new HCV infections per calendar year and not newly diagnosed. Hepatocellular carcinoma referred to the total number of viraemic HCV-related hepatocellular carcinoma cases, rather than new cases. Additionally, all reductions by disease stage were assumed to occur among the viraemic HCV-infected population. The effects of non-HCV-related liver disease were not considered in this analysis.
Base scenario
The base scenario was defined as the scenario where all assumptions (the number of acute cases, treated patients, percentage of patients eligible for treatment, treatment restrictions, the number of newly diagnosed and the average SVR by genotype) remained the same as in 2013-2014. The base scenario was previously described in detail, together with other countries,17,46 and was assumed to be the most conservative scenario. Even more conservative scenarios are possible (e.g., stop treating HCV-infected patients completely), but those were deemed to be unlikely.
As described above, in this scenario we assumed 650 newly diagnosed HCV infections annually and treatment of 880 HCV infections annually in the Netherlands. Treatment in this scenario was focused on patients aged 15-69 years and with a METAVIR score of ≥ F3 assessed using FibroScan. In the light of a future high treatment rate, we considered patients with a fibrosis stage of ≥ F2 (according to METAVIR, measured using FibroScan) eligible for treatment in 2018, and patients with a fibrosis stage of ≥ F0/F1 eligible for treatment in 2021. We assumed SVR rates of 70% for genotype (G) 1 and G3, 80% for genotype 2 (G2) and 50% for genotype 4 (G4). We used fibrosis scores obtained using FibroScans because that is the most common mode of fibrosis assessment at the moment.
Increased efficacy only
A second scenario was developed to assess the impact of improved treatment efficacy without changes in the number of treated or diagnosed patients. Treatment age and fibrosis staging eligible for treatment, as presented in the base scenario, was held constant. In 2015, it was projected that SVR could increase to 80% for G1 and G4, 90% for G2 and 75% for G3. In 2016, SVR was estimated at 90% across all genotypes. These rates were held constant through to 2030.
Increased efficacy and treatment uptake
A third scenario was created to assess the actions necessary to eliminate chronic HCV infection by 2030. Beginning in 2015, treatment uptake was increased by 10% across all genotypes to 970 individuals and the number of diagnoses was increased by 25% to 810 individuals annually. Treatment was open to individuals aged 15 to 69 years. In 2016, treatment uptake was increased to 1210 individuals annually and diagnosis was increased to 890 individuals annually. Patients with fibrosis ≥ F2 were considered eligible for treatment. In 2018, treatment uptake was increased to 1700 individuals annually. Treatment was now also open for patients with fibrosis > F0/F1 and the eligible age range was increased up to 74 years. Treatment and diagnosis uptake were held constant from 2018 through to 2030. In 2021, all patients, regardless of fibrosis staging, were eligible for treatment.
Screening and elimination
A fourth scenario was created to assess the response of increased treatment and the corresponding required increase in screening (and diagnoses) to keep up with treatment. In addition, it was assumed that preventive measures will be taken to reduce the number of new infections by 40% over six years.
Focused treatment: ≥ F3, ≥ F2, ≥ F0/F1
A fifth, sixth and seventh scenario were created to assess the impact of focused treatment of individuals with fibrosis ≥ F3, ≥ F2 and ≥ F0/F1. Starting in 2015 treatment uptake was increased by 10% across all genotypes to 970 individuals and the number of diagnoses was increased by 25% to 810 individuals. In 2016, the treatment uptake increased by 25% to 1210 individuals and the diagnosis rate increased 10% to 890 individuals annually. By 2018, the eligible age range was increased to 74 years while treatment was increased by 40% to 700 individuals, as in this year treatment exceeded eligible individuals. For the ≥ F2 and ≥ F0/F1 scenarios treatment uptake was increased by 40% to 1700 individuals. In 2021, the number of diagnoses was kept constant at 890 individuals. For the ≥ F3 scenario 400 individuals were treated annually. For the ≥ F2 scenario 530 individuals were treated as the treatment outpaced eligibility in 2020. For the ≥ F0/F1 scenario 1700 individuals were treated annually.
Birth cohort effect
The age distribution was determined as described above.10,17 The disease progression model was used to age the HCV-infected population after taking into account mortality and SVR.24 For this analysis, the median age in each five-year age cohort was selected and converted to a birth year. A range of birth years were selected which accounted for approximately 75% (or more) of the total HCV-infected population using the 2014 HCV population distribution.4 The number of people that need to be screened to identify one viraemic case was calculated by taking the inverse of the viraemic HCV prevalence. The number needed to screen to identify one new case was calculated as follows: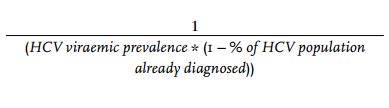
RESULTS
The results of the literature review and expert opinion, including estimates of HCV antibody and HCV viraemia prevalence, diagnosis, as well as annual treatment and liver transplants are summarised in table 2.
Base scenario
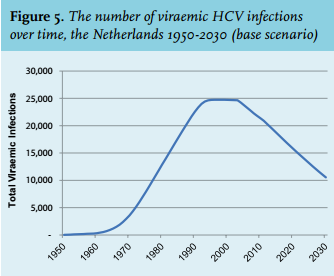
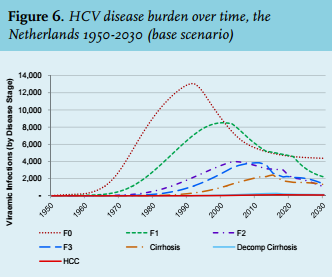
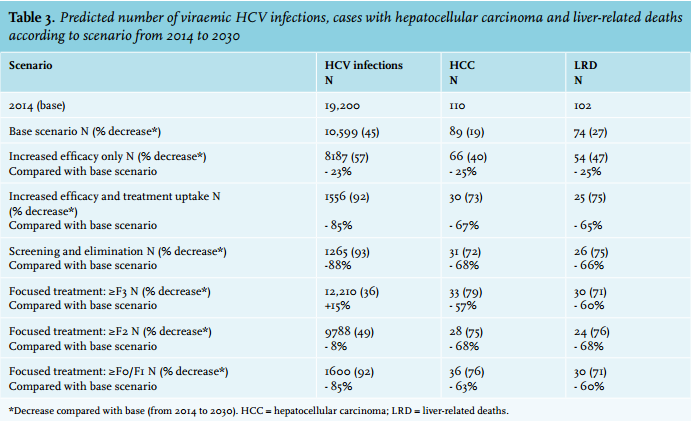
Using historical data,9 it was estimated that there were around 19,200 individuals in the Netherlands with a viraemic HCV infection in 2014. This was forecasted to decrease to 10,599 (45%) in 2030. The number of HCV-related hepatocellular carcinoma cases in 2014 was estimated at 110, and it was forecasted to decrease by 19% by 2030. The number of liver-related deaths in chronic HCV patients was forecasted to decrease 27% from a base of 102. Figure 2 shows the age and gender distribution of the HCV-infected population in 2009 while figure 4 shows the projected age distribution in 2014. Figure 5 shows the number of viraemic HCV infections over time in the Netherlands from 1950 to 2030 and figure 6 shows the projected HCV disease burden for this period. 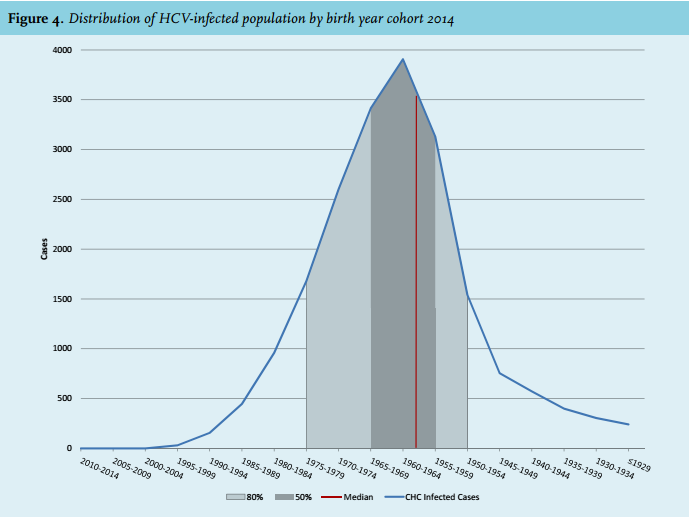
Other scenarios
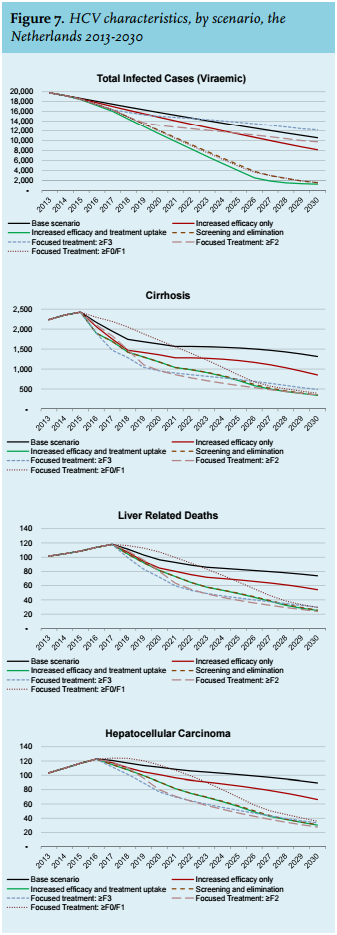
The results of the analyses for HCV morbidity and mortality, by scenario, are summarised in figure 7 and the percent change from the base scenario can be found in figure 8. Table 3 compares the change in HCV disease burden in 2014-2030 by scenario.
Increased efficacy only
There will be 2413 fewer HCV-viraemic individuals in 2030, a 23% reduction as compared with the base scenario. The number of HCV-related hepatocellular carcinoma cases and the number of liver-related deaths both decrease by 25% from the base scenario. This scenario would result in 463 cirrhosis cases being averted.
Increased efficacy and treatment uptake
With an aggressive treatment and diagnosis strategy, there will be 9043 fewer HCV-viraemic individuals in 2030, an 85% reduction as compared with the base scenario. The number of HCV-related hepatocellular carcinoma cases and the number of liver-related deaths in 2030 decrease by 67% and 65%, respectively, from the base scenario. This scenario would result in 964 cirrhotic cases being averted.
Screening and elimination
With a screening and elimination strategy, there will be 9334 fewer HCV-viraemic individuals in 2030, an 88% reduction as compared with the base scenario. The number of HCV-related hepatocellular carcinoma cases and the number of liver-related deaths in 2030 decrease by 68% and 66% respectively from the base scenario. This scenario would result in 972 cirrhotic cases being averted.
Focused treatment: ≥ F3
There will be 1610 more HCV-viraemic individuals in 2030, a 15% increase as compared with the base scenario. The number of HCV-related hepatocellular carcinoma cases and the number of liver-related deaths in 2030 decrease by 57% and 60%, respectively, from the base scenario. This scenario would result in 825 cirrhotic cases being averted.
Focused treatment: ≥ F2
There will be 811 fewer HCV-viraemic individuals in 2030, an 8% reduction as compared with the base scenario. The number of HCV-related hepatocellular carcinoma cases and the number of liver-related deaths in 2030 both decrease by 68% from the base scenario. This scenario would result in 965 cirrhotic cases being averted.
Focused treatment: ≥ F0/F1
There will be 8999 fewer HCV-viraemic individuals in 2030, an 85% reduction as compared with the base scenario. The number of HCV-related hepatocellular carcinoma cases and the number of liver-related deaths in 2030 decrease by 63% and 60% respectively from the base scenario. This scenario would result in 921 cirrhotic cases being averted.
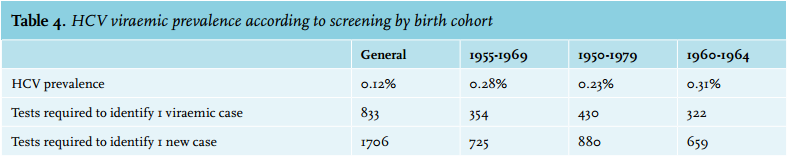
Birth cohort
The median age of the viraemic HCV-infected population in 2014 was 51 years (birth year 1963). More than 50% of the viraemic HCV-infected population was born between 1955 and 1969; over 80% were born between 1950 and 1979 (figure 4). The highest prevalence of HCV viraemia is in the population born between 1960 and 1964 (0.31%). By focusing screening on this birth cohort it is estimated that one case can be newly diagnosed for every 659 screened (after taking into consideration those already diagnosed), if participation rates are equal among HCV-infected and uninfected individuals within this age cohort (table 4). It was assumed that 51% of the total HCV-viraemic population have been diagnosed for all age groups.
Sensitivity analysis
A sensitivity analysis was conducted to assess the effect of variations in different input and outcome parameters (new infections 2014, treatment 2014, fibrosis stage, progression to hepatocellular carcinoma and/or liver-related death) on the key driver of uncertainty in HCV prevalence (range 0.05-0.27%).9 Since the model is based on the incidence of HCV, the number of new HCV infections required to match the reported prevalence was calculated in the model. The top driver reflecting the uncertainty in HCV prevalence is new HCV infections. This has a direct impact on the forecasted population by disease stage, mortality and disease progression. The impact of all other assumptions was small. 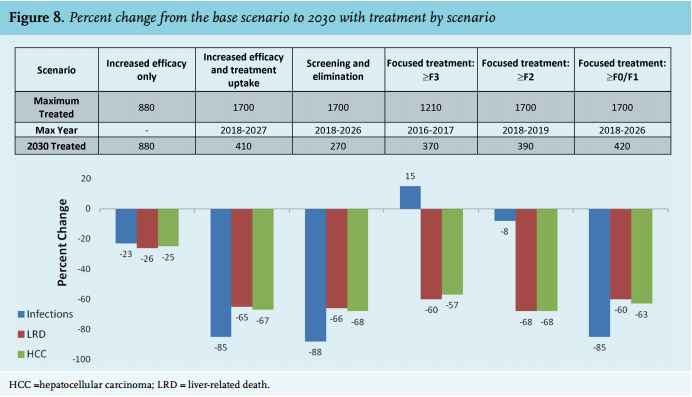
DISCUSSION
Under the current treatment structure, the base scenario, the prevalence of viraemic HCV infection is projected to decrease by 45% over the next 15 years. This sharp decline is likely attributed to successful treatment of HCV infection and lower mortality among the ageing population, in combination with low incidence of new HCV infections. Although transmission of HCV in the Netherlands is low, HCV-related mortality and occurrence of hepatocellular carcinoma is substantial. Treatment of HCV infection in an early stage might prevent the occurrence of HCV-related mortality and hepatocellular carcinoma.
Of all scenarios, the ‘screening and elimination’ scenario predicts the largest reduction of 88% in viraemic HCV infection prevalence in the Netherlands. This scenario is probably not the most feasible scenario as it requires screening and prevention programs to achieve the inputs required. A more realistic scenario would be the ‘increased efficacy and treatment uptake’ scenario, in which a phased increase of treatment uptake is calculated based upon genotype and fibrosis stage. This scenario predicts only a slightly smaller reduction in viraemic HCV infection prevalence compared with the base scenario of 85%.
If we focus on liver-related deaths and hepatocellular carcinoma, the ‘≥ F2 only model’ provides the greatest decrease from the base scenario (both liver-related deaths and hepatocellular carcinoma 68%). However, the decrease in this model is only slightly greater than the decrease predicted by the ‘screening and elimination model’, the ‘increased efficacy and treatment uptake model’ and the ‘> F0/F1 model’ (68% for the ‘≥ F2 only model’ versus 60 to 67% for the other three models). Besides this, the ‘F2 only model’ predicts only a slight reduction in viraemic HCV infection prevalence (8%) whereas the other three models predict a reduction of 85 to 88% compared with the base scenario.
Taken together, it seems that the ‘increased efficacy and treatment uptake’ scenario is the most feasible scenario in the current Dutch situation, which also predicts substantial reductions in viraemic HCV infection prevalence, hepatocellular carcinoma and liver-related deaths. However, due to the current high costs of treatment with DAAs it is very unlikely that this scenario will be adopted in the near future. Lower prices of DAAs are necessary to make this scenario, in which a substantial decrease of prevalent HCV infections can be achieved, more realistic.
Most of the described models require an increase in treatment uptake to 1700 individuals annually and allowing treatment access to individuals regardless of fibrosis stage. Over the last years there have been about 1000 (range: 880-1130) treatments with peginterferon and ribavirin (with or without DAAs) annually.41,42 Assuming that this number is representative of the number of treatments for HCV, an increase from 1000 to 1700 treatments annually may be feasible with the current capacity in the Netherlands as new therapies have a shorter duration and less side effects. Next to this, it should be noted that the increase in treatment uptake per year is only required for the first eight years. After this initial investment, the yearly treatment drops significantly to 270 patients treated yearly by 2030.
Increases in SVR have the potential to result in favourable improvements in end-stage liver disease, with maybe few changes in the ultimate treatment rates. With the new treatment regimens with low side effects, treatment uptake is likely to increase, and with the high SVR rates, the need for retreatment will be low. It is known that curing HCV infection in liver cirrhosis patients reduces complications of cirrhosis and risk of hepatocellular carcinoma.47 However, although reduced, these patients are still at risk of decompensation of liver cirrhosis and/or hepatocellular carcinoma. They are therefore advised to remain in long-term clinical care for monitoring progression of liver disease and/or development of hepatocellular carcinoma. In the current model these patients were not considered as a continued burden of HCV infection after SVR. From this point of view, it might be worthwhile to treat patients before the stage of cirrhosis, as the risk of hepatocellular carcinoma following SVR among patients with F0-1-2-3 is negligible.48 This higher treatment rate (with high SVR rates) for patients with a lower fibrosis stage may have favourable improvements in end-stage liver disease with no changes in the eventual treatment rates and could prevent ongoing transmission.47-49 This might save future costs for follow-up of chronic liver disease (cirrhosis) and long-term hepatocellular carcinoma monitoring. Next to this, achievement of SVR after treatment of chronic HCV reduces non-liver related mortality and hepatic and extra-hepatic manifestations of HCV infection, and improves quality of life. These are all factors in reducing healthcare costs related to HCV infection.50
Achievement of our described strategy to treat more HCV patients is dependent upon the detection of people with HCV infection, thus reinforcing the need for increased awareness and intensified screening among risk groups and professionals.
One might consider a risk-group approach. Alternatively, focusing on a birth cohort of 1960-to 964 without prior assessment of HCV risk might be effective as our model suggests that one newly diagnosed viraemic case may be found per 659 tests, compared with 1 out of 1706 for the general population. This approach was chosen in the USA and was described in 2012.51 However, the effectiveness and cost-effectiveness of a birth cohort screening strategy or a modified birth cohort screening strategy in which additional risk-based screening criteria are used, need to be determined. Also, it is difficult to suggest specific recommendations on birth cohort screening as the age and gender distribution of the viraemic HCV-infected population in the Netherlands is not well known.
For first-generation migrants born in countries where HCV infection is endemic, and other difficult-to-reach risk groups for HCV, various pilot screening projects have been performed in recent years, using different screening strategies.52-57 However, the costs and effectiveness of these strategies relative to each other has not been studied yet, hampering efficient targeting of screening programs. Moreover, there is no structural screening program for migrant groups in place and combining HCV screening with screening for other infections might be considered. We suggest that cost-effectiveness analyses of screening strategies targeted at first-generation migrants should be performed and awareness among risk groups as well as healthcare professionals should be increased. Increasing knowledge of HCV infection among healthcare professionals and the general population may also lower the barriers of testing and referring.58
Besides migrants, two other groups require attention. The first group consists of people who have already been diagnosed with a viraemic infection in the past (e.g. HCV-infected blood donors) but have been lost to follow-up in clinical care. The feasibility to retrieve these individuals should be investigated. The second group is more difficult to find because it is hidden in society: individuals that have injected drugs in the past, acquired a tattoo in an endemic region, or received a blood transfusion before 1992. For this group, again, awareness should be increased for both the individuals themselves and the healthcare professionals, in particular general practitioners and public health workers. Innovative approaches such as internetmediated blood screening services58 might be considered. There are some factors that limit the value of the described outcomes of the prediction models. First, many parameters that were used as input are based on assumptions or data of less recent years. These data include the current and future number of diagnosed and treated viraemic HCV infections, and the distribution of genotype, fibrosis stage, age and gender of treated and untreated patients. Retrieving actual figures on the different parameters in the Netherlands is very difficult, as there is no national registry of HCV patients in place. The sensitivity analysis that was conducted with the key driver of uncertainty in HCV prevalence was in turn driven by uncertainty in the number of new HCV infections. The impact of all other assumptions was small. Second, parameters were not specified per risk group. These groups, however, have different characteristics, including the proportion diagnosed, genotypes, treatment rates and treatment outcome, influencing the outcome of the models. Third, factors such as sex differences and HIV infection, and their impact on clearance and HCV disease progression, have not been taken into account. Fourth, in this analysis it was assumed that the number of new infections and re-infections remained constant in all scenarios described. While disease progression models can predict disease burden, they are less accurate for estimating future prevalence as they do not explicitly model HCV transmission nor include the possibility of re-infection following successful therapy.59 Finally, FibroScan was used for assessing the fibrosis score as a selection criterion for treatment and defining the different groups for the models. This might not be the most accurate method as FibroScan scores are only reliable in low (F0) and high (F4) ranges, but are not between METAVIR scores F1 to F3. Also, FibroScan does not differentiate between METAVIR scores F2 and F3. Fibrosis staging in this range should be done using a liver biopsy.
These limitations may lead to incorrect inputs and estimations, leading in turn to incorrect predictions. Over time, the input of the models may have to be adjusted and updated, and linked with transmission models to achieve correct predictions.
In conclusion, the largest decrease in viraemic HCV infections in the Netherlands may be achieved by applying the ‘elimination’ strategy. Preventing progression of HCV-related liver disease leading to HCV-related death and hepatocellular carcinoma is best achieved when using the ‘≥ F2 fibrosis’ strategy. The most realistic scenario with reasonable reductions in HCV prevalence, HCV-related death and hepatocellular carcinoma would be the ‘increased efficacy and treatment uptake’ strategy with a phased increase of treatment uptake. To be able to achieve these future goals, diagnosis of people with HCV infections in the Netherlands who may benefit from treatment should be increased. Prevalence data and knowledge regarding facilitating and impeding factors for HCV screening are needed for the largest risk groups separately (including the different migrant groups). Awareness among risk groups and professionals as well as the general population should be increased whereas barriers on different levels (practical, psychological) should be lowered.
A coordinated national strategy and sufficient financial means to support it are needed to achieve these goals. The presented models on the future disease burden might inform our national strategy.
ACKNOWLEDGEMENTS
This study was commissioned by Gilead Sciences with an unrestricted grant.
Expert panel meetings were organised and facilitated by Gilead Sciences (experts were invited and notified, the meeting room was booked and food and drinks were provided).
We would like to thank Erin Gower for her contributions in developing the initial models that were used as basis for this analysis.
DISCLOSURES
S.B. Willemse: AbbVie (C), BMS (C,R), Gilead Sciences (C,R), Roche (C).
D. Razavi-Shearer: AbbVie (R), Boehringer Ingelheim (R), Gilead Sciences (R), Intercept (R).
F.R. Zuure: AbbVie (R), Boehringer Ingelheim (R), Gilead Sciences (R), MSD (R), Roche (R).
I.K. Veldhuijzen: none.
E.A. Croes: none.
A.J. van der Meer: Gilead Sciences(C), MSD (C).
D.K. van Santen: none.
J.M. de Vree: none.
R.J. de Knegt: AbbVie (C,R), BMS (C,R), Gilead Sciences (C,R), Janssen Therapeutics (R), Medtronic (R), MSD (C,R), Norgine (C), Roche (C,R).
H.L. Zaaijer: Janssen Therapeutics (C), Gilead Sciences (C,R), Roche (C).
H.W. Reesink: AbbVie (C,R), Alnylam (C), BMS (C,R), Boehringer Ingelheim (R), Gilead Sciences (C,R), Janssen Therapeutics (C,R), Merck/MSD (C,R), PRA-International (C,R), Regulus (C,R), Replicor (C,R), Roche (C,R), R-Pharm (C).
M. Prins: Gilead Sciences (C,R), MSD (C,R), Roche (C,R).
H. Razavi: AbbVie (R), Boehringer Ingelheim (R), Gilead Sciences (R), Intercept (R).
C: Consultancy; R: Research.
REFERENCES