KEYWORDS
Blood pressure variability, epidemiology, haemodynamics, risk factors, standard deviation
INTRODUCTION
For nearly a century, office blood pressure (BP) measurement has been the basis for hypertension evaluation and management, along with the main principles and techniques of BP recording,1 which rely on BP measurements, using a brachial cuff-based sphygmomanometer.2 However, BP readings may vary considerably, not only in the long term, but also in the very short term (i.e., beat to beat or within a single visit),3-5 affecting the precision of BP assessment and decision making about BP-related risk and hypertension management. To address the variation between BP readings, the European guidelines for the management of arterial hypertension recommend that three sequential office BP measurements should be recorded after five minutes of rest in a seated position with the back and arm supported, while additional measurements are required if the first two readings of systolic BP differ by > 10 mmHg, and the average of the last recorded BP measurements should be used.6 Similarly, other international hypertension recommendations, including the American and Canadian guidelines, recommend the use of the average of two or more BP readings.7,8 Although BP variability, within 24 hours, day-to-day, and visit-to-visit, has been extensively evaluated and associated with cardiovascular events and mortality.9,10 limited and inconsistent evidence exists,2,11 particularly on the assessment and clinical impact of BP variability during a single medical visit.12 Therefore, in the present study, we aimed to investigate the predictive ability of within-visit variability for all-cause mortality, over and above BP levels.
MATERIALS AND METHODS
The present study used data from the National Health and Nutrition Examination Survey (NHANES), which is a stratified multistage probability survey conducted in non-institutionalised individuals in the United States, and was administered by the National Center for Health Statistics (NCHS).13 Details on the NHANES have been described elsewhere.14 The following data were extracted and used in our analysis: age, sex, smoking status, history of hypertension, diabetes mellitus, hypercholesterolaemia, myocardial infarction, angina, coronary heart disease, congestive heart failure, and stroke. Medical history was self-reported during the medical history interview.15
Mortality data
The NCHS has linked various surveys, including NHANES, with death certificate records from the National Death Index (NDI), providing an opportunity to conduct a vast array of outcome studies designed to investigate the association of a wide variety of health factors with mortality. In the present study, we used these data to explore the predictive ability of specific facets of systolic (SBP) or/and diastolic (DBP) short-term variation occurring within a triplicate of sequential measurements of BP levels.
Blood pressure measurement
BP was measured using a specific protocol and equipment described in detail at the ‘Physician Examination - Procedures Manual’ of NHANES.16 BP and heart rate measurements were performed using a stethoscope and an inflation system including an arm BP cuff and a sphygmomanometer. The inflation system consists of a latex inflation bag, a Calibrated® V-Lok® cuff, a Latex Inflation Bulb, and an Air-Flo® Control Valve. The pressure gauge is a Baumanometer® calibrated mercury true gravity wall model. All equipment was regularly subjected to quality control checks. A stopwatch was used to standardise the time between consecutive BP readings.
All subjects were asked if they had consumed any food, coffee, alcohol, or if they smoked in the past 30 minutes before the examination. Although intake of coffee, cigarettes, and other vasoactive substances could affect BP, this information was not used to exclude subjects from BP measurements in the NHANES survey. BP was measured in the right arm. If a BP measurement was not possible in the right arm due to specific known or self-reported conditions which prohibited the use of the right arm, then the measurements were performed in the left arm. All measurements were taken in a sitting position and after at least a five-minute resting period. In order to obtain an accurate BP reading, the appropriate cuff size was determined for each subject following a standardised procedure.16 Three sequential BP measurements were obtained on the same arm. If a BP recording was interrupted for any reason, a fourth measurement was obtained. There was a minimum time-interval of at least 30 seconds between repeated BP measurements.
Analysis of within-visit variation of three repeated BP measurements
The degree of SBP and DBP variation of three repeated measurements was quantified using various statistical indices.
Standard deviation of the three SBPs (SBPSD) and DBPs (DBPSD) repeated measurements was calculated using the following equation, where N = 3 measurements, x = systolic or diastolic BP, and the average of the three SBP or DBP values.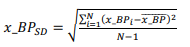
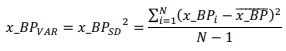
Variance of the three SBPs (SBPVAR) and DBPs (DBPVAR) repeated measurements was calculated using the following equation.
Coefficient of variation of the three SBPs (SBPCV) and DBPs (DBPCV) measurements was calculated as the ratio of x_BPSD to the mean value of the three x_BP measurements where x = systolic or diastolic BP.
Maximum absolute difference (MAD) of SBP (SBPMAD) and DBP (DBPMAD) was expressed as the maximum absolute difference between any two readings among the three repeated sequential SBP and DBP measurements, respectively.
Statistical analysis
The correlations between continuous variables were evaluated by Pearson correlation coefficient. Collinearity between continuous variables was assessed by the variance inflation factor and tolerance determined via multiple regression models. To assess differences among the three repeated sequential BP measurements, we performed general linear models for repeated measurements with Least Significant Difference test for post-hoc analysis of multiple comparisons. Multiple logistic regression models were also used to identify independent factors predicting all-cause mortality. Backward, step-wise modelling was initially used as a first exploratory approach.
Finally, various multivariable models were constructed using the enter method. Sensitivity and specificity of indices of BP variation for the prediction of mortality were determined by Receiver Operator Characteristic (ROC) curves. Finally, we evaluated the incremental prognostic performance of DBP variability on top of the core model of established risk factors for all-cause mortality by calculating: a) the difference in area (s) under the curve (AUC) from corresponding ROC curves, b) the categorical net reclassification index NRI (NRI) as previously described,17 and c) the integrated discrimination improvement index (IDI). The core model consisted of age, sex, heart rate, BMI, traditional risk factors for cardiovascular diseases (CVD) (e.g., smoking, diabetes, hypertension, hyperlipidaemia), and already adjudicated CVD. All of these factors are well-established factors of increased all-cause and CV mortality as previously reported18-22 and therefore may act as confounders in the association between DBP within-visit variability and all-cause mortality. Given the lack of pre-defined risk categories of all-cause mortality in our research population, event rate was used to derive the cut-offs implemented in the NRI analysis. Statistical significance was accepted for p-values < 0.05. Statistical analysis was conducted by IBM SPSS Statistics for Windows, (Version 25.0. Armonk, NY: IBM Corp.) and STATA package, version 11.1 (StataCorp, College Station, Texas USA).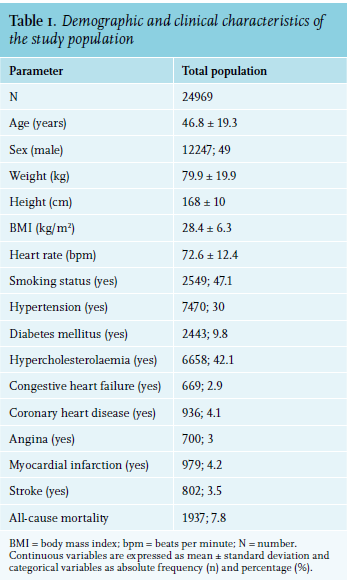
 RESULTS
A complete set of three sequential BP measurements, together with survival status, was available for 24969 individuals (all above 17 years of age). A total of 19012 subjects were free of history of any CVD or cancer. Time to event was not available in the current dataset. Demographic and clinical characteristics of the examined populations are reported in table 1.
Differences among three sequential BP readings
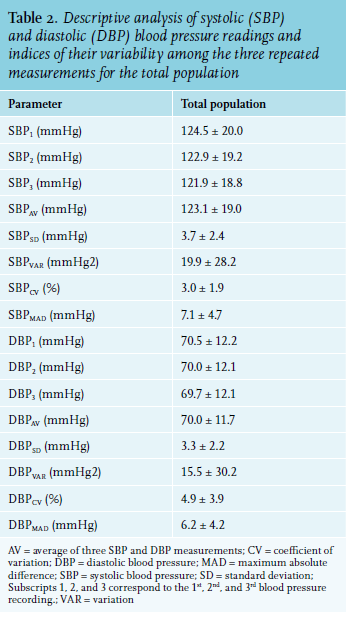
Descriptive characteristics of single, average, and variability indices of SBP and DBP measurements are reported in table 2. Analysis of variance for repeated measures (corrected for multiple comparisons) indicated that the mean value of SBP for the total population varied significantly from measure-to-measure (p < 0.001). Specifically, the first SBP value was significantly decreased in the 2nd measurement (SBP2) by 1.3% (p < 0.001) while the difference between the third (SBP3) and the first (DBP1) measurement was -2.1% (p < 0.001). SBP3 was also significantly lower than SBP2 by 0.8% (p < 0.001).
Similarly, the DBP significantly varied and gradually decreased within the three repeated BP readings (p < 0.001), but to a lesser extent than SBP (FANOVA for SBP = 2430 and FANOVA for DBP = 294). Specifically, DBP2 was decreased by 0.7% and DBP3 by 1.1% compared to DBP1 (p < 0.001). The difference between DBP3 and DBP2 was -0.4% (p < 0.001).
Mortality and within-visit variation of BP measurements
We initially performed an exploratory multivariable logistic regression analysis, using backward (step-wise) method for the determination of the stronger independent predictors of total mortality (table 3); these were age, sex, heart rate, SBP, DBPSD, history of diabetes mellitus, hypercholesterolaemia congestive heart failure, coronary heart disease, and stroke (table 3). Concerning the within-visit variability of three repeated measurements of DBP, it was observed that an increase of DBPSD by one unit (SD) was associated with 6.4% increased odds of all-cause mortality. Importantly, when DBPCV replaced DBPSD, it remained a significant independent parameter in the model, indicating that the increased variation of DBP can predict mortality regardless of the mean DBP level (DBPCV = DBPSD/DBPaverage). In that case, increase of DBPCV by 1% was associated with 3.6% increased odds of all-cause mortality. Finally, we constructed several multivariable logistic regression models (enter method) to determine the independent predictors of all-cause mortality after adjustment for various independent variables such as demographic and clinical parameters, and average SBP and DBP. In each model, only one variability index of SBP and DBP (i.e., SD, variance, coefficient of variation, or maximum absolute difference) was entered. It was found that DBPSD was an independent significant predictor of all-cause mortality as reported in table S-1 (Supplementary information)*. Demographic and clinical characteristics of study population by quartile of DBPSD are reported in table S-5 (Supplementary information).
Reclassification
DBP variability conferred incremental reclassification value over the core model for prediction of all-cause mortality (overall NRI = 0.454, p < 0.001). Using DBPSD, 210 subjects who died were correctly reclassified into a higher risk category, while 118 participants were falsely stratified as high risk (table S-2, Supplementary information). In addition, increased DBP variability improved the discriminative ability of the core model for the prediction of all-cause mortality (overall IDI = 25.2, standard error = 1.1, p < 0.001).
Association of within-visit BP variability with age and other risk factors
We examined which factors, including age, are related with enhanced variability of SBP and/or DBP within a triplicate of sequential BP readings. The association of age on within-office BP variability was assessed by Pearson correlation coefficients (table S-3, Supplementary information). All indices of within-visit variability of SBP were significantly and positively correlated with age, albeit all correlations were weak (r < 0.3). The DBP variability indices showed an even weaker association with age (r < 0.02).
We further developed eight multivariable linear regression models with each variability index used as dependent variable and age, together with other demographic and clinical parameters as independent variables. After adjustment (enter method) for all other independent factors, age was significantly and positively associated with all SBP variability indices, while heart rate was inversely associated with all SBP variability indices (table S-4, Supplementary information). In contrast, within-visit variability indices of DBP were inversely related with age, and positively correlated with heart rate; overall DBP variability presented lower standardised correlation coefficients (beta) compared to those between SBP within-visit variability and age. Overall, SBP and DBP within-visit variability were associated with BP levels (table S-4, Supplementary information).  DISCUSSION
To the best of our knowledge, this is the first demonstration that within-visit variability of three sequential DBP measurements is an significant predictor of all-cause mortality, independent of demographic and clinical characteristics. Specifically, an increased SD of three repeated DBP measurements (DBPSD) is associated with greater odds of all-cause mortality after adjustment for relevant confounders.
Short-term (24-hour, day-to-night, representing exaggerated circadian BP variations), medium-term (day-to-day) and longer-term (visit-to-visit) BP variability have been associated with increased cardiovascular risk and mortality in subjects with and without hypertension and irrespective of a baseline cardiovascular risk.23,24 However, limited evidence exists examining the clinical relevance of within-visit BP variability. Li et al. measured BP three times at 5-minute intervals with the use of a validated semi-automated electronic device in 1222 subjects.25 It was reported that within-visit DBP variability, as measured by the maximum absolute difference (MAD) between any two BP readings, was related to increased carotid intima-media thickness and internal carotid plaque in the normotensive population, whereas SBPMAD was associated with internal carotid plaque in hypertensive patients under antihypertensive therapy, after adjustment for established cardiovascular risk factors.25
Another study aimed to evaluate the association between within-visit SBP and DBP variability and the development of pre-diabetes and diabetes longitudinally.26 Variability of SBP/DBP was assessed using the maximum difference between the three BP measures. It was demonstrated that there was a 77% higher progression to pre-diabetes/ diabetes over a three-year follow-up period for individuals with high, compared to low, within-visit SBP variability, independent of major risk factors.26 In another study, type-2 diabetes mellitus and pre-diabetes were associated with slightly greater within-visit variability (as measured by SD) of both SBP and DBP.27
In a large-cross subclinical survey (BP-CARE, Blood Pressure control rate and CArdiovascular Risk profilE) of 6425 treated hypertensive patients living in Eastern European countries,28 within-visit variability of SBP (but not of DBP) was quantified as coefficient of variation and SD of three repeated SBPs within a single visit. Elevated within-visit SBP variability was associated with several cardiovascular risk including metabolic syndrome, resistant hypertension, impaired renal function, an increased calculated cardiovascular risk, and a higher rate of previous cardiovascular events.28 Furthermore, increased within-visit variability of SBP and DBP was associated with an increased risk of stroke in a post-hoc analysis of the Anglo-Scandinavian Cardiac Outcomes Trial-Blood Pressure Lowering Arm (ASCOT-BPLA).29
Overall, the above-mentioned evidence suggests that within-visit BP variability, assessed by a simple and inexpensive approach, is associated with target organ damage and cardiovascular factors. However, there is limited and controversial evidence concerning the predictive ability of within-visit BP variability for all-cause mortality.12
Within-visit BP variability and mortality
Similar to our study, Muntner et al30 analysed the data from 15317 individuals from the NHANES III survey (3848 deaths), aiming to explore the association between within-visit variability of SBP/DBP and all-cause as well as cardiovascular mortality. Within-visit BP variability (assessed by the SD of three repeated SBP and DBP measurements) was not associated with an increased risk of all-cause or cardiovascular mortality.30 In our study, we also observed that within-visit variability of SBP could not predict mortality, however, DBPSD (and other indices including DBPVAR, DBPCV, DBPMAD) independently predicted all-cause mortality. Nevertheless, in our study a much larger population with a greater percentage of events (deaths) was examined, using a quite different set of independent variables for the adjustment of the predictive models.
In another study, five consecutive BP readings were obtained from a randomly recruited Flemish population of 2944 subjects.31 Within-visit SBP variability did not have any prognostic significance over and beyond mean SBP. Nonetheless, in a subgroup analysis, within-visit SBP variability was an independent predictor of the study’s endpoints in women and patients on antihypertensive drug treatment.31 Within-visit DBP variability readings were not analysed.
Hara et al, using a double-blind design, randomly allocated 4695 patients (≥ 60 years) with isolated systolic hypertension to active treatment or matching placebo and investigated whether on-treatment SBP level, visit-to-visit variability, or within-visit BP variability predicted total or cardiovascular mortality.32 Increased SBP level, but not SBP variability, predicted mortality, while BP-lowering treatment reduced cardiovascular complications by decreasing the level, but not the variability of SBP.32 However, the analysis of this study was limited to SBP measurements.32
Limitations
The findings of the present study should be interpreted within the context of some potential limitations. Although several complex indices and formulas have been described in the literature for the quantification of BP variability, we used the most common and traditional metrics of variability (i.e., SD, variance, coefficient of variation, maximum difference between measurements) in our analyses. In the NHANES survey there was no standard, fixed, time-interval between repeated BP measurements; a minimum interval of at least 30 seconds was applied. Although, specific drug usage was not analysed in our multivariable models, we found that adjusting models for antihypertensive treatment did not alter our findings (data not shown). Finally, the current data cannot provide any causative role or mechanisms through which the reported increase in within-visit DBP variation is linked to elevated risk. As we are moving to unattended office BP measurement using automated or semi-automated electronic BP devices that reduce the white coat effect, the predictive ability of within-visit BP variability needs to be further evaluated.
Nonetheless, it should be highlighted that evidence suggests that short-term BP variations are more pronounced when autonomic reflex cardiovascular control is impaired,28,33 arterial stiffness is increased,34 and responsiveness of the central nervous system to environmental and emotional stimuli is enhanced.28,35
CONCLUSION
In the era of precision medicine, the findings of this study may have pertinent clinical implications. Within-visit DBP variability assessment through a triplicate of sequential office BP readings may allow the identification of high-risk patients more accurately than SBP and DBP levels alone. Since multiple BP readings are already integrated into everyday clinical practice, the analysis of within-visit BP variability might be an additional simple and cost-effective way to augment precision in risk assessment. In this context, the prognostic value of BP variability within one visit and methods to improve its clinical application are worthy of further research.
DISCLOSURES
All authors declare no conflicts of interest. No funding or financial support was received.
*The supplementary information (S-tables 1-5) is available upon request; please contact the corresponding author.
REFERENCES