KEYWORDS
Data registration, disease severity, HSMR, patient outcomes, quality indicator
INTRODUCTION
Since March 2014, Dutch hospitals are obliged to be transparent about their mortality rates.1 To be able to compare the quality of hospital care using their mortality rate, these rates have to be standardised in order to correct for the differences in the case-mix.2 This standardised ratio is represented in the hospital standardised mortality ratio (HSMR) and is the ratio of the observed to the expected deaths, derived from data from the national registration of hospital care, the LBZ.3 The expected deaths are calculated with the use of a statistical model that corrects for certain factors such as age, socioeconomic status and comorbidity.3 In 2014, this model contained standardised mortality ratios (SMRs) for 50 diagnosis groups, which account for 80% of in-hospital deaths. This was extended to SMRs for 157 diagnosis groups in 2015.
Over the year 2014, the VU Medical Centre, Amsterdam (VUmc) had a relatively high HSMR, in part caused by a high SMR for the diagnosis group ‘pneumonia’. The SMR of a diagnosis group can be used to investigate the cause of unexpected high mortality in a hospital more specifically than by solely using the HSMR.4 For this reason a commission of independent external investigators in the VUmc were asked to investigate this high SMR. The aim was to investigate whether preventable/avoidable factors contributed to these deaths. Their report showed no avoidable causes of death in this cohort. These findings suggest that the cause of the high SMR for pneumonia is probably due to other unknown factors. It could, for example, be caused by insufficient registration of comorbidities or wide variations in disease severity. In the clinical setting, physicians and nurses use several different scoring systems to determine the severity and to predict the mortality of pneumonia using patient characteristics such as age, blood urea and respiratory rate. Two of the best-validated and most used scoring systems are the Pneumonia Severity Index (PSI)5 and the Abbreviated Mortality in Emergency Department Sepsis score (abbMEDS).6
The HSMR is calculated by the Central Bureau of Statistics (CBS) and the data used for this calculation are registered by Dutch Hospital Data (DHD) within the context of the LBZ. The Medical Administration Office of each hospital provides the information that is used. The HSMR is, among other covariates, derived from the primary diagnosis and the Charlson Comorbidity Index (CCI),7 which are obtained from patients’ charts and documented by coders. This underlines the importance of a complete administration, as deficient or faulty data might directly influence the HSMR. Van der Laan et al. (2013)8 showed that the effect of registering 10% more comorbidities could result in a decrease of 5 points of the HSMR.8 Although the administration of data has improved significantly since the implementation of the HSMR as an indicator of quality of care, there still might be inconsistencies in the comorbidity data extracted by coders and registered by DHD, when compared with the actual data extracted by doctors from the patients’ charts.8,9
Therefore, the main aim of this study was to examine whether the HSMR model underestimates or overestimates the disease severity of pneumonia patients when compared with routinely used clinical severity scores. Our secondary aim was to investigate the completeness of the data sent to DHD to calculate the HSMR.
MATERIAL AND METHODS
In 2014, 32 deceased patients were registered in the ‘pneumonia’ group at the VUmc. In order to obtain PSI and abbMEDS scores for these patients, patients’ charts were examined for information needed to calculate these scores from which corresponding mortality probabilities could be calculated. Missing information was considered as not contributing to the score.
The HSMR is calculated by logistic regression using the below-mentioned covariates with data provided by hospital coders. With this information, regression coefficients for these covariates are estimated and are used to calculate mortality probabilities for each individual admission.3 The results of the calculations are send to each hospital in the annual HSMR report.
The HSMR is calculated using the following covariates3 :
In order to compare the mortality probabilities derived from the PSI and abbMEDS scores (which correspond with ordinal risk categories) and the mortality probabilities calculated by the CBS (which can be considered a continuous variable), new categories needed to be formed for the latter. It was decided to form three sets of categories from the CBS data, one for each of the scores. Table 1 shows the risk categories and corresponding mortality probabilities of the three scoring systems. The consensus was that the best way to establish limits for new categories was by using the median between each of the mortality probabilities, as those are the means of that risk category. As can be seen in table 1, the lowest risk categories of the PSI predict a risk of 0.1% and of 0.6%. The median between these risks is 0.35, therefore, the limits of the PSI categories used are 0-0.35; 0.35-0.75; 0.75-5.2; 5.2-18.1; 18.1-100 and the limits for the abbMEDS are 0-11.55; 11.55-32.85; 32.85-100.
The newly formed categories of the CBS calculated mortality probabilities were compared with the categories of the PSI and abbMEDS scores. A Wilcoxon sign-rank test was used for statistical analysis to test for conformity
To investigate whether data sent to DHD significantly differed from what is found in patients’ charts, data were gathered on the total amount of comorbidities that were present in charts, which of these were directly of influence to the CCI (excluding the comorbidities that are not in the Charlson Comorbidity Index) and finally the estimated CCI by the hospital itself. The coders in VUmc primarily look at the discharge letter and only broaden their scope when they presume this to be insufficient. In this study one researcher (JVE) thoroughly checked every patient’s chart which included the discharge letter. If there was any uncertainty concerning a possible comorbidity or diagnosis, a second researcher (PN) was consulted and consensus was reached. The data that the CBS used were obtained from the Medical Administration Office. A paired t-test was used to analyse the difference between our registration and the coders’ registration. For all analyses, a two-tailed p-value of less than 0.05 was considered statistically significant.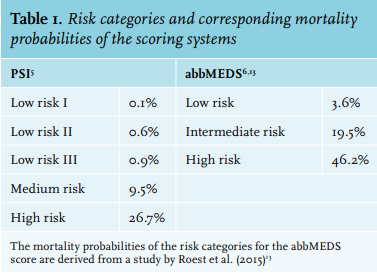
RESULTS
Table 2 gives an overview of the patient characteristics of our population. Ten patients had a cause of death other than respiratory failure or sepsis.
Mortality probabilities
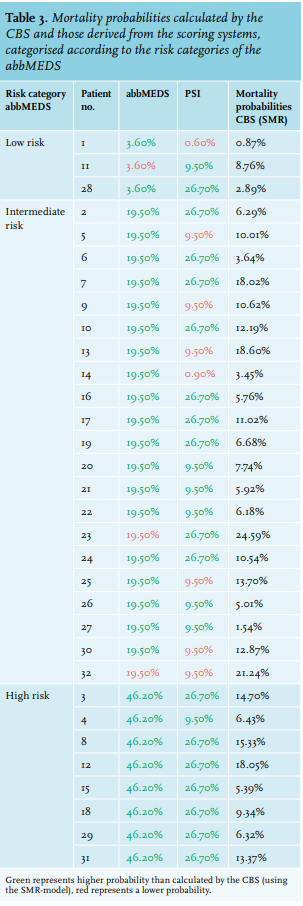
Table 3 illustrates the dispersion of mortality probabilities calculated by the CBS using the HSMR model and those of the two clinical scoring systems. It can be seen that for the majority of patients the estimated risk of dying within 28-30 days is much higher according to the clinical scoring systems than the estimated risk of dying as calculated using the SMR model. Especially the abbMEDS assesses the risk to be significantly higher than the CBS does. In our cohort of patients, the abbMEDS seemed to estimate the severity of pneumonia the best. This is why we categorised the table according to the risk categories of the abbMEDS.
Descriptive statistics of conformity were performed and this showed that for the PSI 18 patients were in a higher risk category than according to the CBS (SMR), 3 were in a lower category and 11 were in the same category. When looking at the abbMEDS, all patients were either in the same risk category (10) or in a higher risk category (22) compared with SMR.
Further analysis showed a significant increase in assigned risk categories for the PSI (p < 0.001) and for the abbMEDS (p < 0.001) compared with the SMR. This indicates that risks of dying of these patients, according to clinical scoring systems, were significantly higher than the risks of dying according to SMR calculated by the CBS.
Registration of data
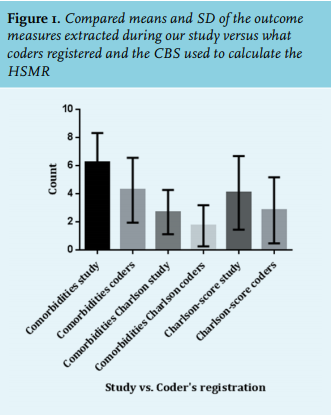
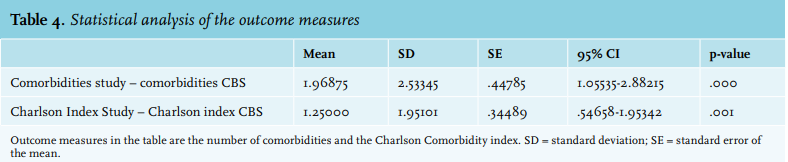
Figure 1 shows the number of comorbidities, the number of comorbidities influencing the CCI and the calculated CCI itself from our own registration and those same outcome measures which medical coders registered. For each of the outcome measures the mean of our registered number is higher than the mean of what the coders registered.
As table 4 shows, the mean difference between the number of comorbidities in our registration and the coders’ registration is 1.97. The mean difference between our registration and the coders’ registration for the CCI is 1.25. All of these results are statistically significant.
An unanticipated finding was that the source of admission was ‘home’ in every case. It seemed as though no distinction was made between ‘home’ and ‘nursing home’. Nevertheless, table 1 shows that 6 out of 32 patients were admitted from a nursing home. 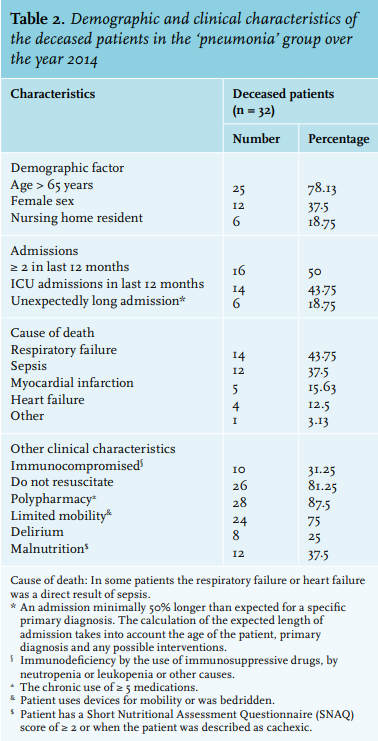
DISCUSSION
The findings in this paper indicate that (1) the SMR model appears to underscore the severity of pneumonia compared with the validated clinical scoring systems PSI and abbMEDS in a cohort of patients who died of pneumonia; and (2) the total number of comorbidities and the number of comorbidities influencing the CCI is higher according to our registration than according to the coders’ registration.
The results in this study further support the suggestion that was made by Pleizier et al. that the SMR for more diagnosis groups besides cerebrovascular diseases will also decrease when adjusted for the severity of disease.11 They concluded that within the SMR group ‘cerebrovascular diseases’ there is no distinction between ‘stroke’, ‘cerebral haemorrhage’ and ‘subarachnoid haemorrhage’ while their mortality rates differ greatly.11 The mortality rates were 18, 43 and 35%, respectively, and when these differences were not taken into account, the influence on the SMR could be considerable.12 They recalculated the SMR for ‘cerebrovascular diseases’ after correcting for the above-mentioned sub-diagnoses and found that this gave a reduction from 119 (95% CI 105-133) to 102 (95% CI 91-115).11 Beside this diagnosis group, this is possibly also true for other SMR groups such as the ‘pneumonia group’. A subdivision for ‘cerebrovascular diseases’ was easily made by just looking at the mortality rates for several subdiagnoses within that group. This, however, is a lot harder for a diagnosis group such as ‘pneumonia’, where there are no known distinct subdiagnoses. To make a subdivision for ‘pneumonia’, two different scoring systems were used that indicate severity of disease. The best way to prove that a subdivision by each of these scores has a direct effect on the SMR is by adjusting the SMR model in the same way Pleizier et al. did.11 They incorporated a division in risk categories into the logistic regression model, just as the other covariates. In our study, it was decided to compare the mortality probabilities of the validated scores with the mortality probabilities calculated by the CBS with the use of the SMR model.
The results show that for the large majority of patients the expected mortality within 28-30 days is much higher according to the two scoring systems than to the score calculated by the CBS. This is probably partly caused by underscoring the number of comorbidities, but also a lack of proper adjustment for the severity of the disease pneumonia in the individual patient. These two scoring systems are widely used in clinical settings when dealing with pneumonia patients and have been validated.5,13 They are specifically designed to assess the severity of pneumonia/sepsis and should therefore be taken seriously as predictors of death. This suggests that the mortality probabilities according to the HSMR model of CBS are an underestimation of the real risk of dying for each patient. Naturally, estimating disease severity with the use of nine variables results in a simplification of reality. In addition, it is known that university medical centres predominantly provide tertiary care for a case-mix of patients with a higher severity of disease than peripheral hospitals. Therefore, they might falsely have a ‘higher’ HSMR.
Our results indicate that the mortality probabilities calculated by the PSI and the abbMEDS are higher than what the CBS calculated. It could be argued that the steps between the risk categories of these scoring systems are fairly big. Therefore, when a patient is placed in the highest risk category of, for example, the abbMEDS their risk of dying could be even higher than 46.2%. However, table 3 does compare categorical variables (the mortality probabilities calculated by the scoring systems) with a continuous variable (the mortality probabilities calculated by the CBS), which implies that these risks will almost always differ from the risks as calculated by the CBS.
The secondary aim of this study was to assess the registration of comorbidities from the patients’ charts by medical coders. As stated earlier, we discovered that the source of admission was ‘home’ in every case, although six of the patients in our cohort were admitted from a nursing home. This could potentially have an impact on the HSMR as a whole; however, this influence is probably rather small. It must be acknowledged that the source of admission is not primarily registered by coders, but they are responsible for checking this registration.
Van der Laan et al. already underlined the influence of the registered number of comorbidities on the HSMR.8 With this in mind, an average difference of two registered comorbidities seems significant enough to be of influence to the HSMR. For a comorbidity to be of influence to the HSMR it needs to add to the CCI; so, to make the previous assumption more likely, the CCI of every patient was also taken in consideration. It was found that there was a statistically significant difference of 1.25 points between the calculated CCI based on our registration and the calculated CCI based on the coders’ registration. This strongly suggests that the apparently insufficiently registered number of comorbidities does directly influence the HSMR. As stated earlier, coders are dependent on proper documentation by others, including doctors. They primarily look at the discharge letter and operation reports, and are not expected to go through the entire patient chart, mainly since this would be too time consuming. This lack of time might be one of the causes of the apparent under registration of comorbidities. One other cause explaining the under registration is that according to coding protocol, sometimes an International Classification of Diseases (ICD-10) code which has less impact on the HSMR than the actual diagnosis has to be selected. Although the precise impact cannot be judged by the results of this study, these findings do raise the question whether the HSMR is reliable enough to estimate what it is supposed to do or to be published for everyone to see.
The limitations of this work must be acknowledged. The self-formed categories composed to compare categorical and continuous variables are merely based on what was thought to be the most logical way to do this. Hence, a note of caution is due here when interpreting these results. Also, in this study no control group was investigated. This withholds the opportunity to compare the mortality probabilities of the living patients with the deceased patients and therefore we were not able to investigate if the severity of disease was greater in the deceased group. Finally, it would have been interesting to calculate the HSMR/SMR using our calculated CCI and compare this with the HSMR/SMR calculated by the CBS. Unfortunately, computing our own logistic regression model to perform these calculations proved to be too time consuming.
CONCLUSION
Hospitals are obliged to publish their HSMRs, which gives patients and healthcare institutions the opportunity to judge and compare hospitals on the basis of this number. However, we demonstrated that differences in case-mix and the incompleteness of the data used to calculate the HSMR could negatively influence the HSMR. Although it seems quite logical to look at the number of deaths in each hospital as an indicator of quality of care, there are numerous pitfalls hidden in using the HSMR as a quality indicator. Therefore, HSMR should always be interpreted with caution and openly publishing HSMRs may have unfair negative consequences for some hospitals.
DISCLOSURES
All authors declare no conflict of interest. No funding or financial support was received.
REFERENCES